VIRTUAL Price on the Verge of a Breakout? 3 Bullish Signs Say “Yes”

VIRTUAL’s 88% rally may only be pausing. Three bullish indicators hint that the next breakout could be much closer than traders expect.
Virtuals Protocol (VIRTUAL) has exploded nearly 88% in the past week but has since moved sideways near $1.45. That might look like a pause after a big rally, but under the surface, several indicators are flashing bullish for the VIRTUAL price.
Three strong signs show that the token could be preparing for another leg up.
Flag Pattern Holds Firm as Divergence Signals Strength: The First Bullish Sign
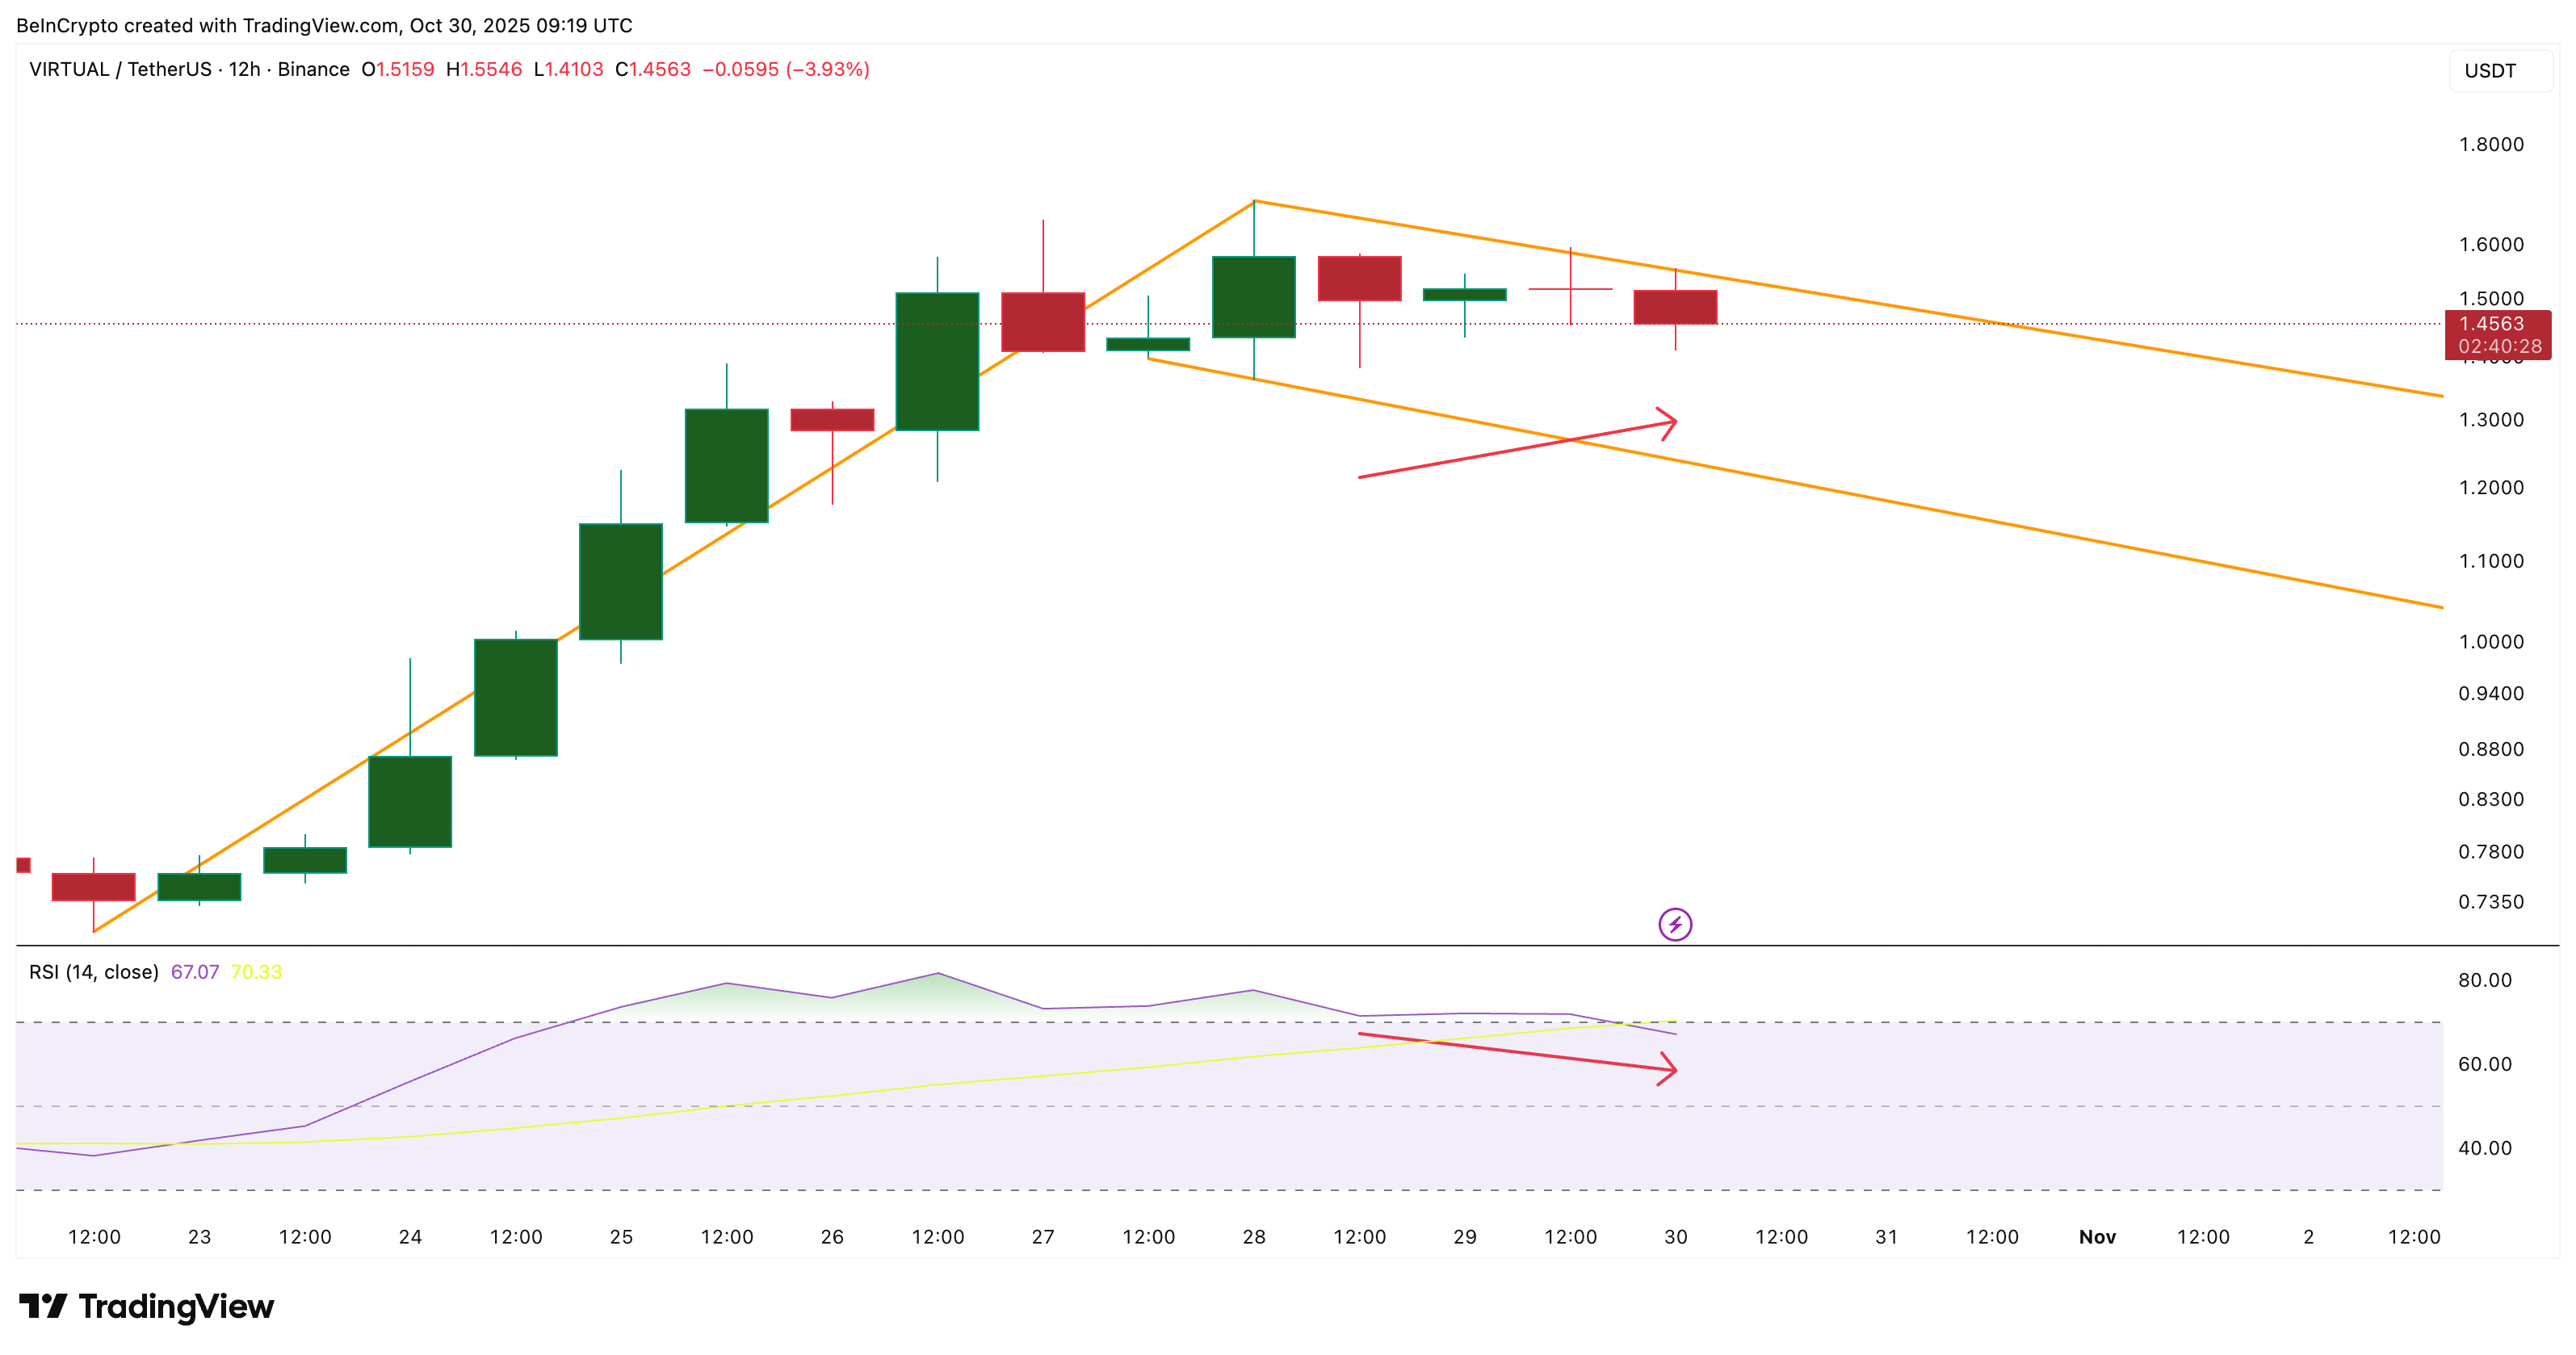
On the 12-hour chart, VIRTUAL is consolidating inside a bullish flag (pole and flag) pattern, which forms after a steep rally when traders pause before pushing higher. The pattern is tightening near the upper trendline, hinting that pressure is building for a breakout.
Between October 28 and 30, the token’s price made a higher low, while the Relative Strength Index (RSI) made a lower low. This phenomenon, termed hidden bullish divergence, happened during the flag-based consolidation.
RSI measures buying versus selling strength. And in VIRTUAL’s case, it hints at bullish continuation. In short, sellers are losing control even though price growth has slowed.
Want more token insights like this? Sign up for Editor Harsh Notariya’s Daily Crypto Newsletter.
 VIRTUAL Forms A Real Flag:
TradingView
VIRTUAL Forms A Real Flag:
TradingView
If VIRTUAL breaks above the flag’s upper trendline, the setup could confirm a new uptrend. But the breakout hopes aren’t random, and we have another bullish sign next.
Moving Averages Add Weight to the Breakout Case: The Second Sign
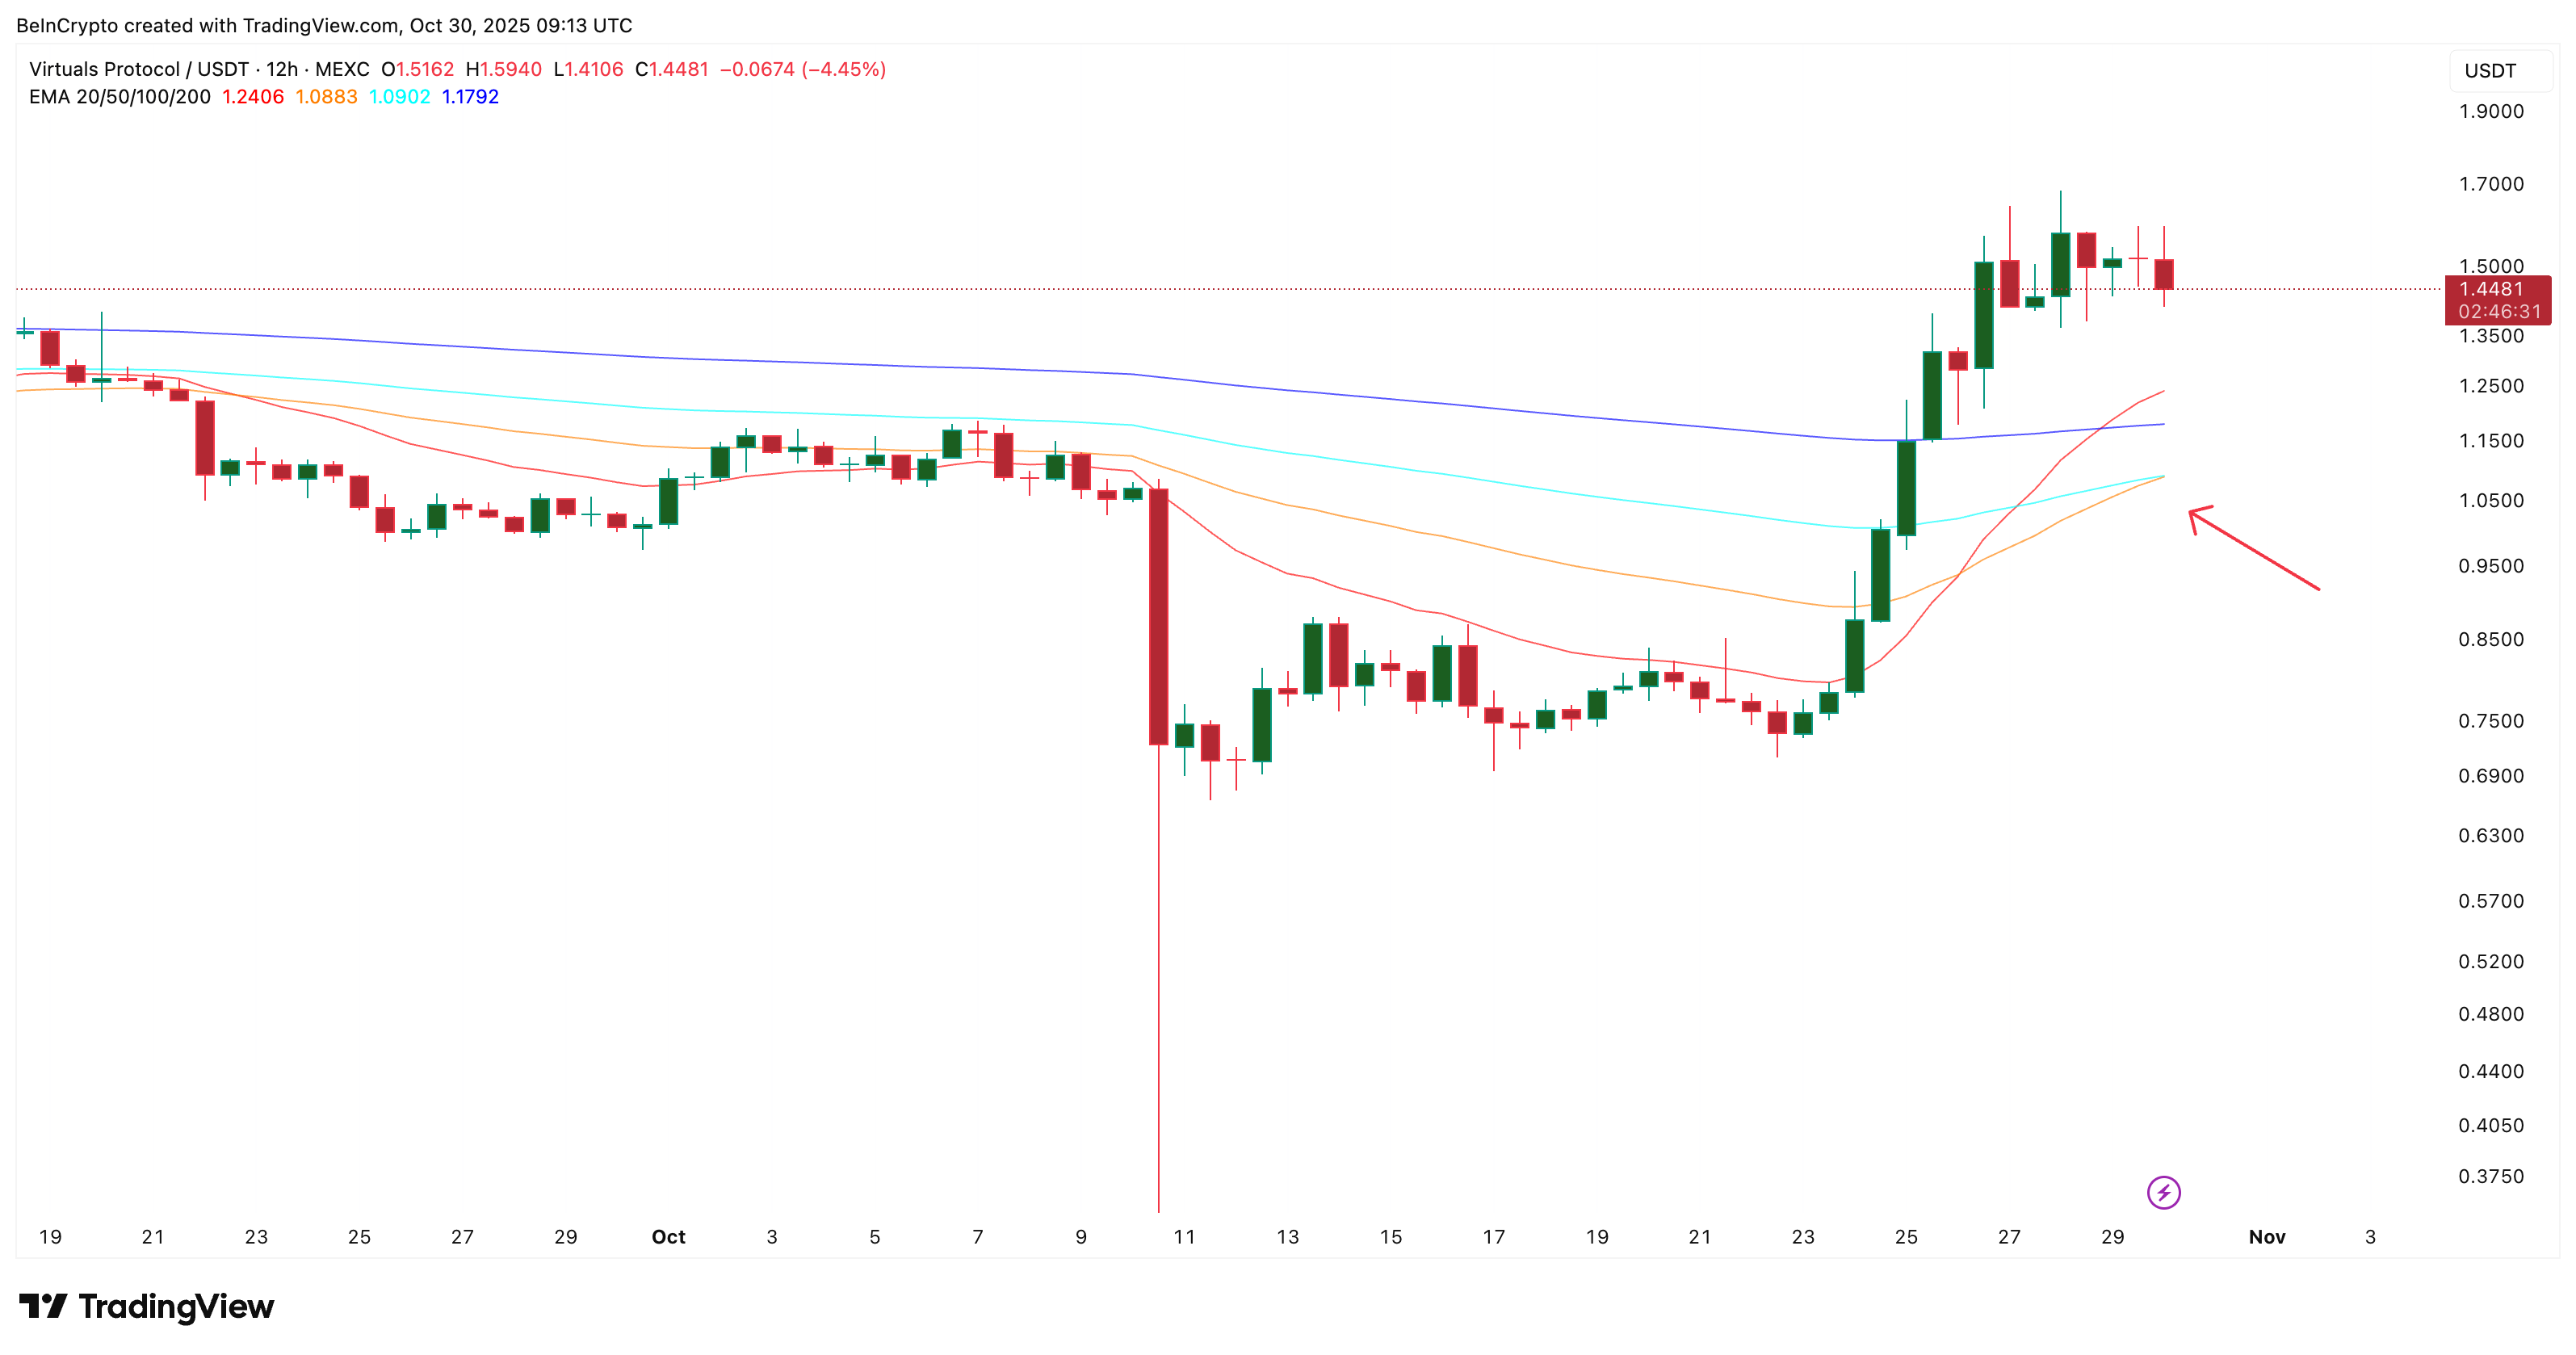
Adding to the bullish pressure, the 50-period Exponential Moving Average (EMA) is about to cross above the 100-period EMA.
The EMA smooths out price data to highlight recent momentum trends. When a shorter EMA crosses above a longer one, it often marks the start of a new bullish phase.
 VIRTUAL Finds Golden Crossover Catalyst:
TradingView
VIRTUAL Finds Golden Crossover Catalyst:
TradingView
This crossover comes right as VIRTUAL’s price tests the upper flag boundary. It is a rare alignment that reinforces the breakout hypothesis. If both the EMA crossover and a close above the upper trendline happen together, it could act as a double confirmation of strength.
Smart Money Builds Positions Ahead of the VIRTUAL Price Move: The Third Sign
While retail traders might be waiting for clearer signals, smart money — the term used for experienced or institutional investors — is already showing its hand.
The Smart Money Index (SMI), which tracks the flow of funds from informed traders, has been trending higher since early October, despite a few dips along the way. The index has made higher highs consistently, even as prices consolidate, suggesting quiet accumulation behind the scenes.
 Smart Money Flowing In:
TradingView
Smart Money Flowing In:
TradingView
This increase in smart money activity typically precedes price expansion, suggesting that big players expect the flag to resolve higher.
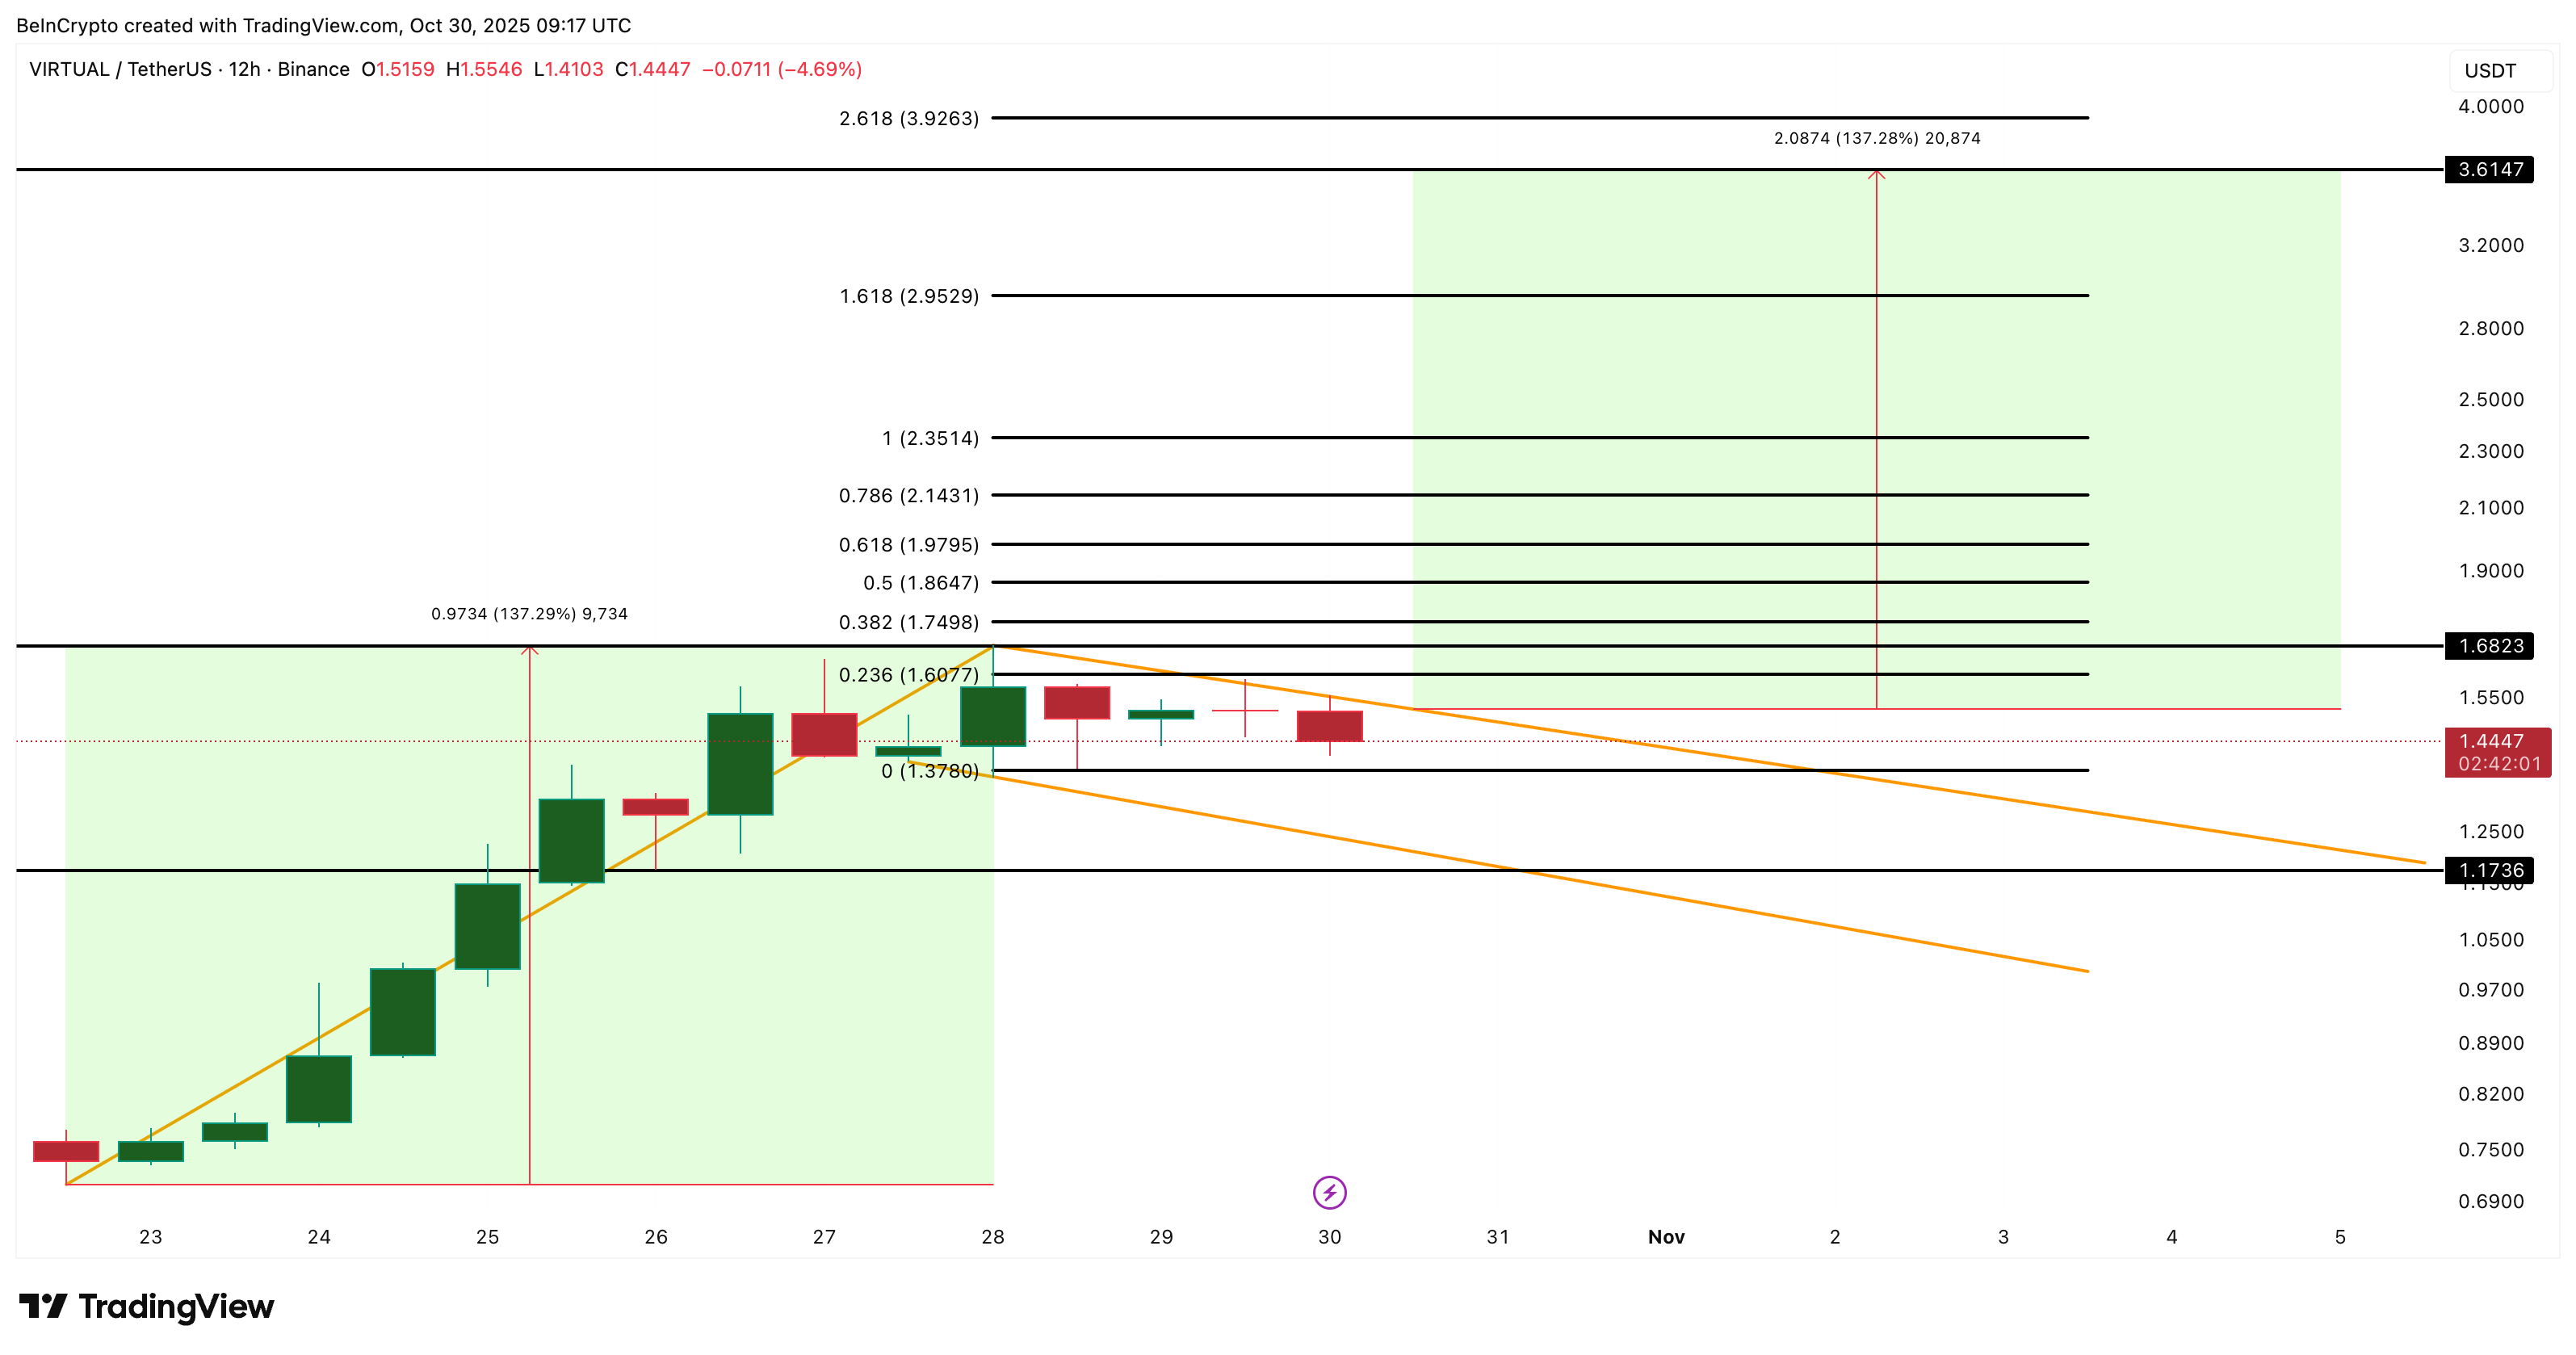
If the VIRTUAL breakout above $1.60 holds, potential upside targets lie at $3.61 (per pole projection) and $3.92, according to Fibonacci projections. However, post the breakout, VIRTUAL might find the strongest resistance near $1.97 (right before the psychological barrier of $2) and $2.95 (ahead of $3).
 VIRTUAL Price Analysis:
TradingView
VIRTUAL Price Analysis:
TradingView
That said, if support at $1.37 followed by $1.17 breaks, it would likely invalidate this setup. That would signal a longer consolidation phase instead.
Disclaimer: The content of this article solely reflects the author's opinion and does not represent the platform in any capacity. This article is not intended to serve as a reference for making investment decisions.
You may also like
From yen rate hikes to mining farms shutting down, why is bitcoin still falling?
The recent decline in bitcoin prices is primarily driven by expectations of a rate hike by the Bank of Japan, uncertainty regarding the US Federal Reserve's rate cut trajectory, and systemic de-risking by market participants. Japan's potential rate hike may trigger the unwinding of global arbitrage trades, leading to a sell-off in risk assets. At the same time, increased uncertainty over US rate cuts has intensified market volatility. In addition, selling by long-term holders, miners, and market makers has further amplified the price drop. Summary generated by Mars AI This summary was generated by the Mars AI model, and the accuracy and completeness of its content are still being iteratively updated.

The Economist: The Real Threat of Cryptocurrency to Traditional Banks
The crypto industry is replacing Wall Street's privileged status within the American right-wing camp.

Grayscale's Top 10 Crypto Predictions: Key Trends for 2026 You Can't Miss
The market is transitioning from an emotion-driven cycle of speculation to a phase of structural differentiation driven by regulatory channels, long-term capital, and fundamental-based pricing.
From Yen Interest Rate Hike to Mining Farm Shutdown, Why Is Bitcoin Still Falling
The market is down again, but this may not be a good buying opportunity this time.