An arguable thesis is that crypto is close to a major upside rally. The altcoins total market capitalization has made higher highs and higher lows since the bull market began. If the most recent higher low is now in, the rally could be about to begin. $XRP and $ADA are two crowd favourites that are well set for big surges.
$XRP higher lows force price against solid resistance

Source: TradingView
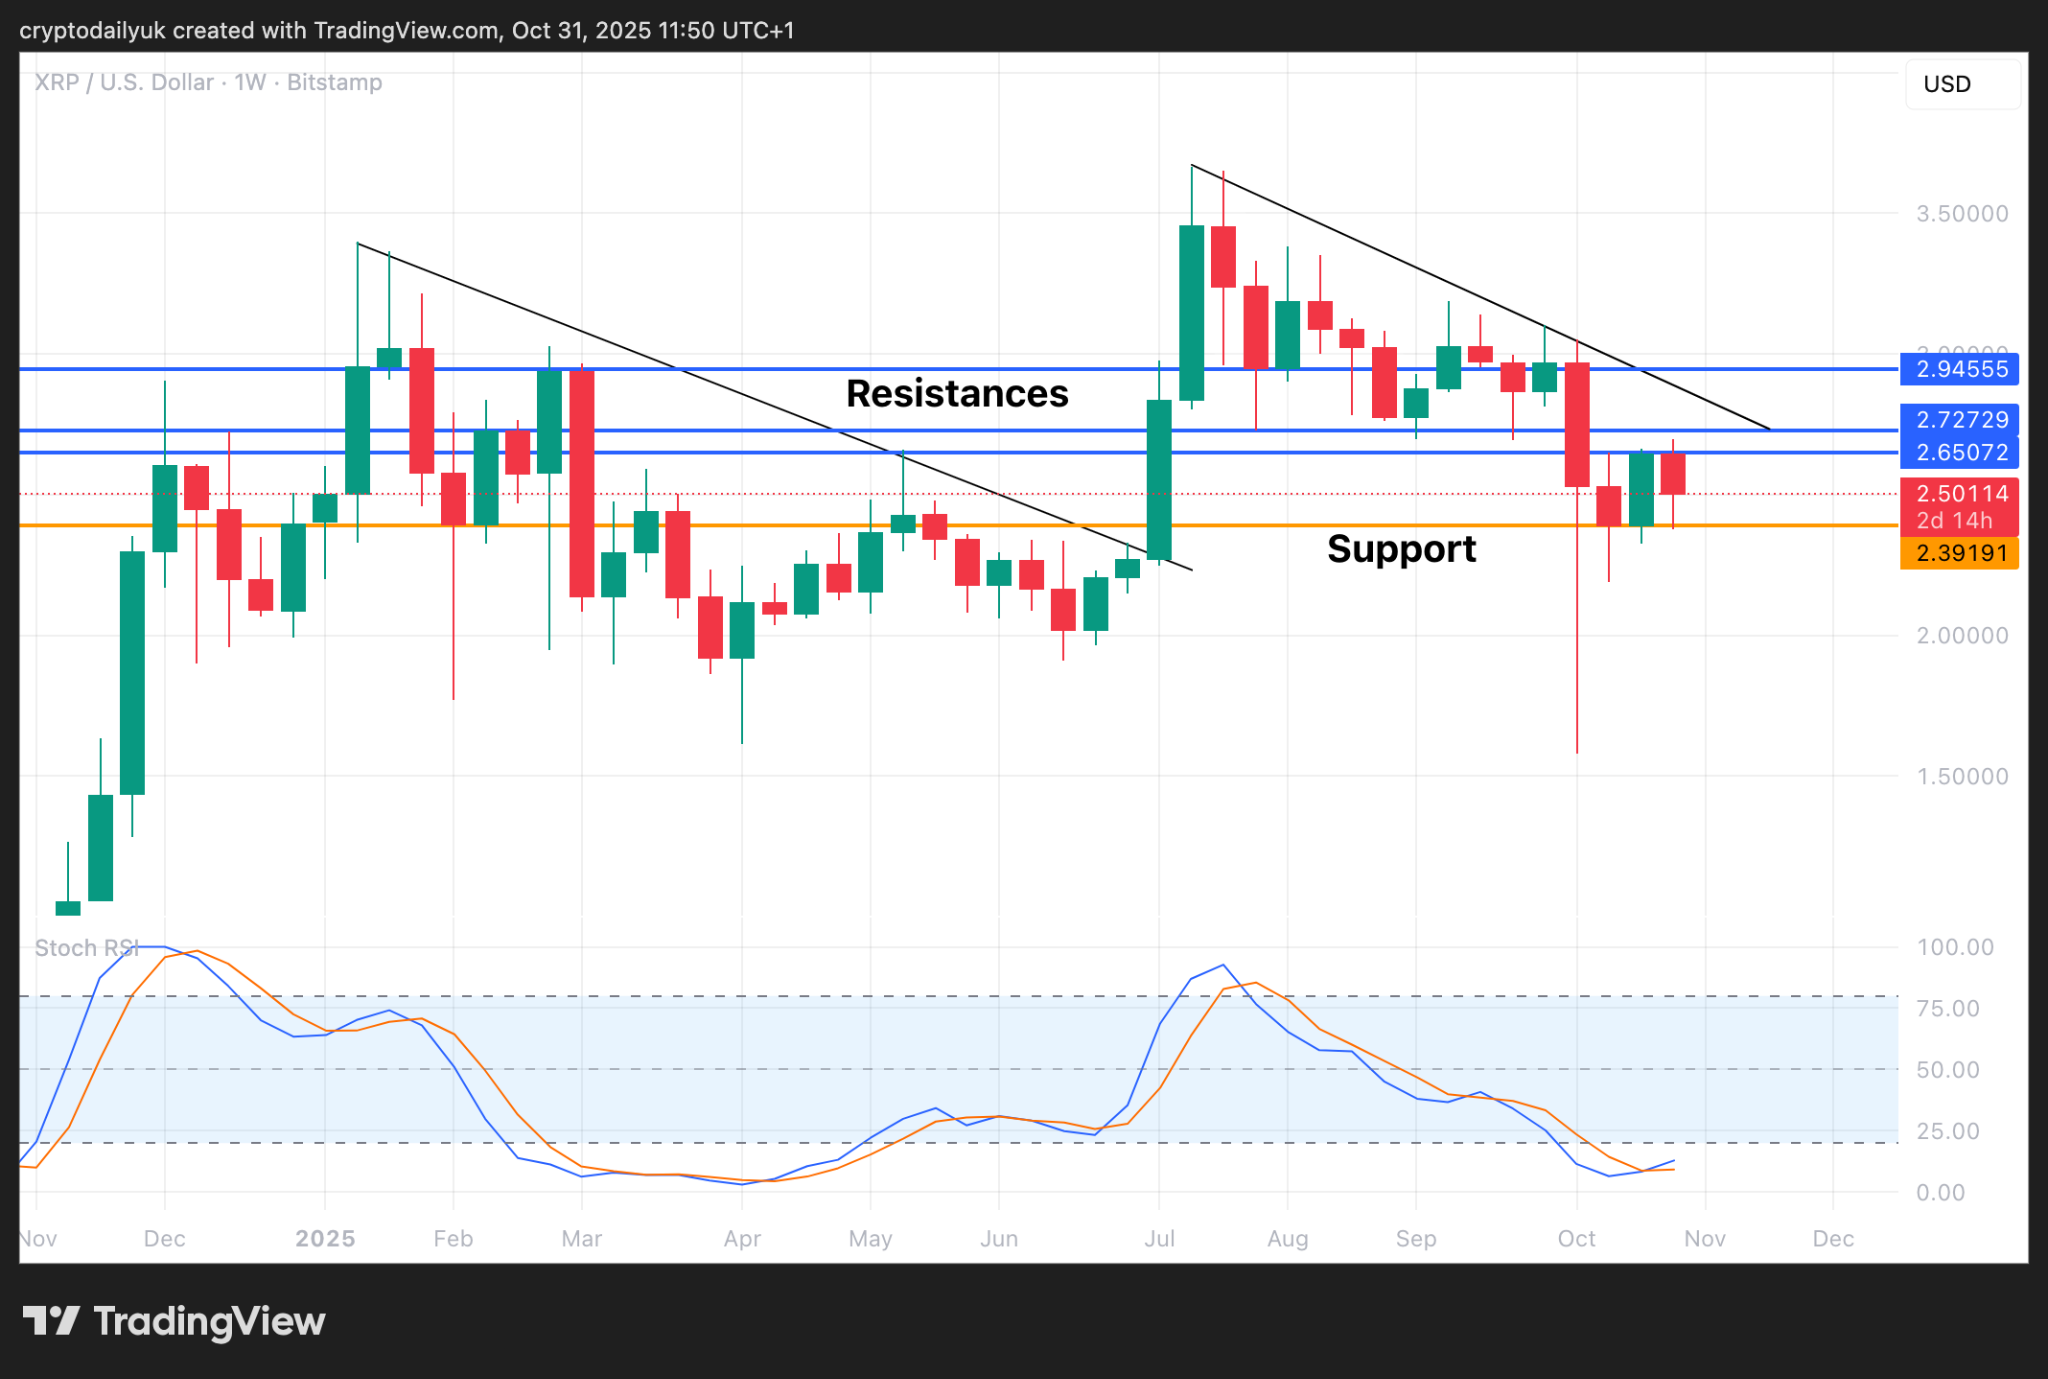
The weekly chart for $XRP does show a lower low from the crypto melt-down on the 10 October. However, that can probably be taken as an outlier, especially given how quickly the price was bought up again. Since then, the price has come up continually against the $2.65 horizontal resistance level, from where it has been soundly rejected each time. On a positive note, higher lows have continued to be set.
The $XRP price has been going sideways and downwards for quite some period of time now - 15 weeks to be precise. This was after the run-up from $2 to $3.66, so a period of consolidation was probably sorely needed. We’ve had that now, so it might be expected that a breakout could occur, especially considering that the Stochastic RSI indicators have just crossed up.
$XRP target over $5

Source: TradingView
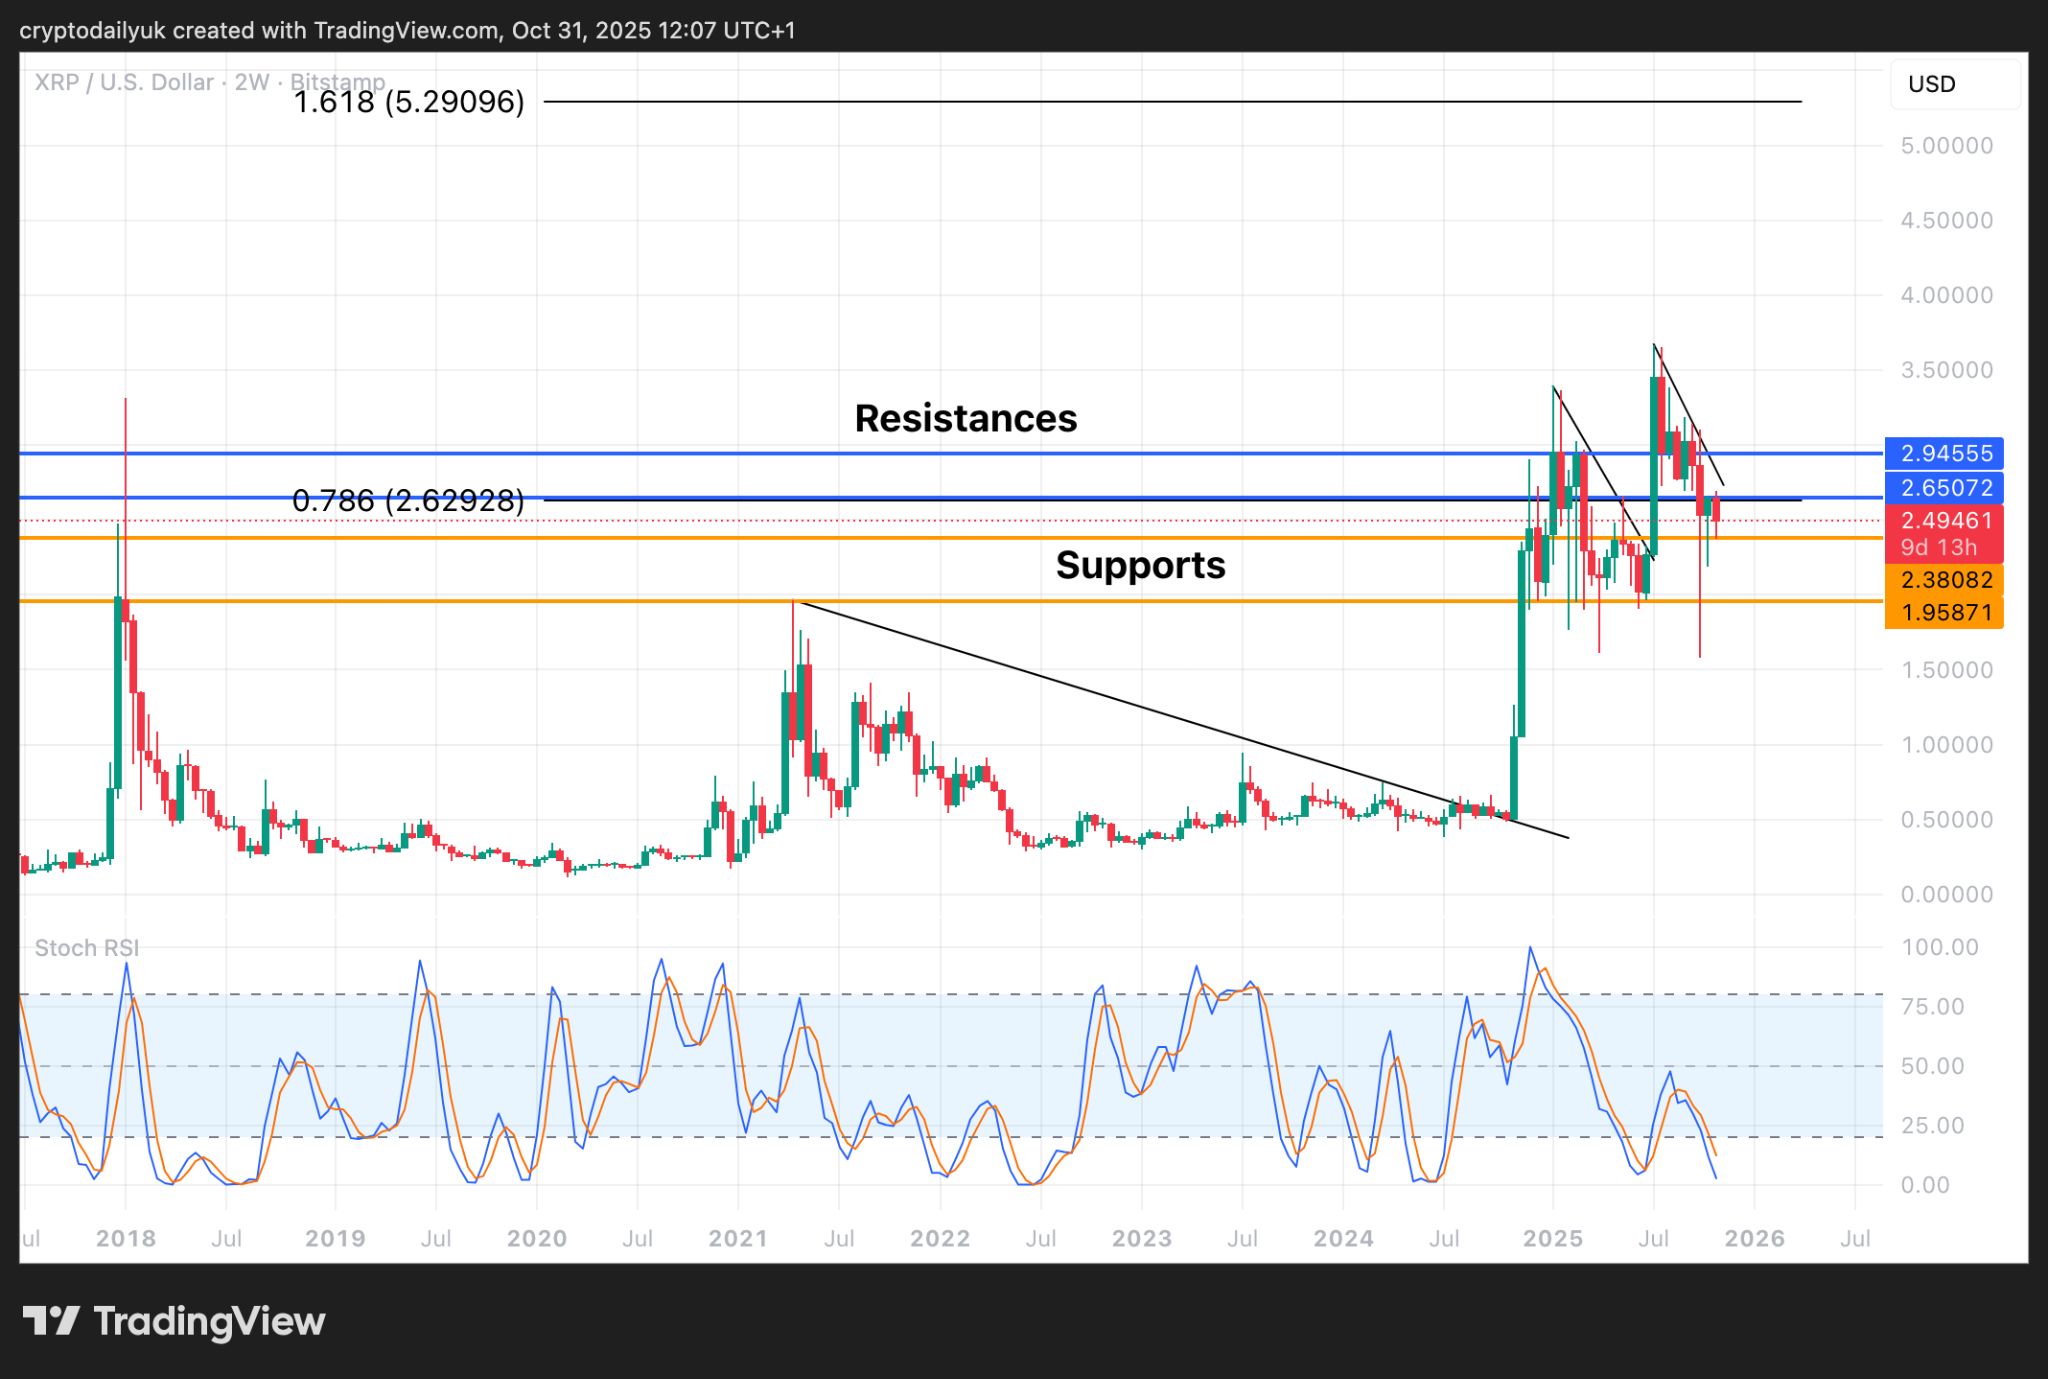
The 2-week chart illustrates the $XRP price action since 2018. It can be seen that a price step has formed around $2, and all price action since then has remained above, except for mostly longer wicks below.
If one refers to Fibonacci extension levels, the 0.786 at $2.63 is where the price is being resisted currently. One more main level of resistance is above this at just under $3.
Looking much further out, and a possible target for this bull market, is the 1.618 Fibonacci at $5.30. With the 2-week Stochastic RSI indicators also bottoming, some major upside price momentum could be just around the corner.
$ADA multi-year trendline soon to break?

Source: TradingView
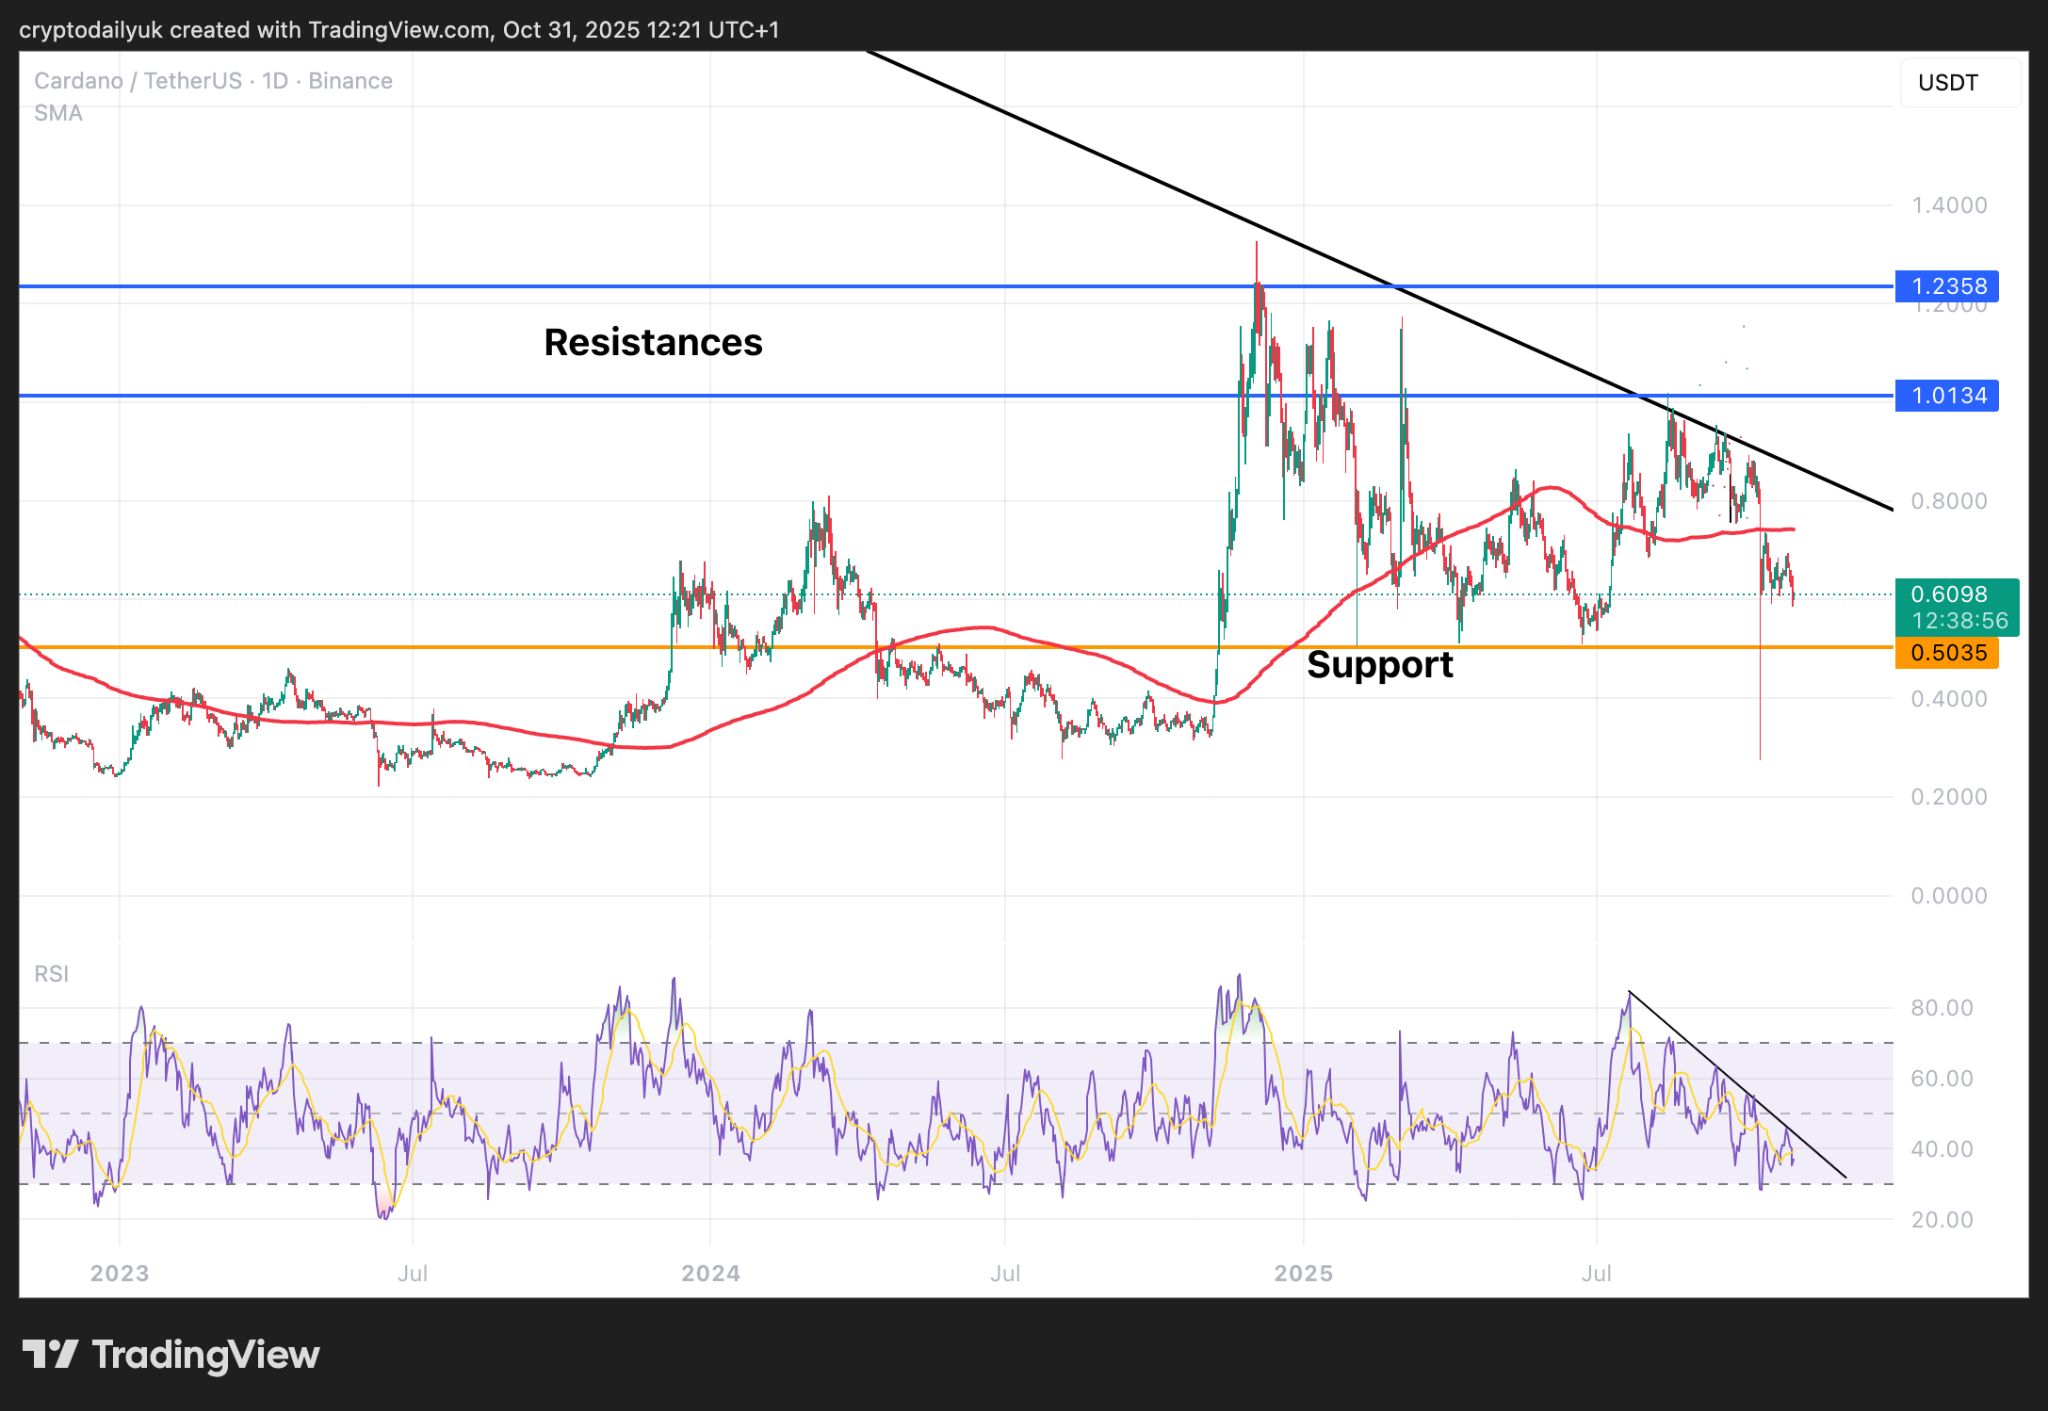
The $ADA chart is nowhere near as simple and as bullish as the $XRP chart. The daily chart above shows that the price is once more below the 200-day simple moving average (SMA), where it has been for a fair bit of this bull market so far. However, the multi-year descending trendline is more likely than not to break, and if it does, this could provide plenty of upside momentum.
The RSI at the bottom of the chart illustrates a downward trend. This is likely to break soon.
$ADA price momentum trump card - but will it be enough?

Source: TradingView
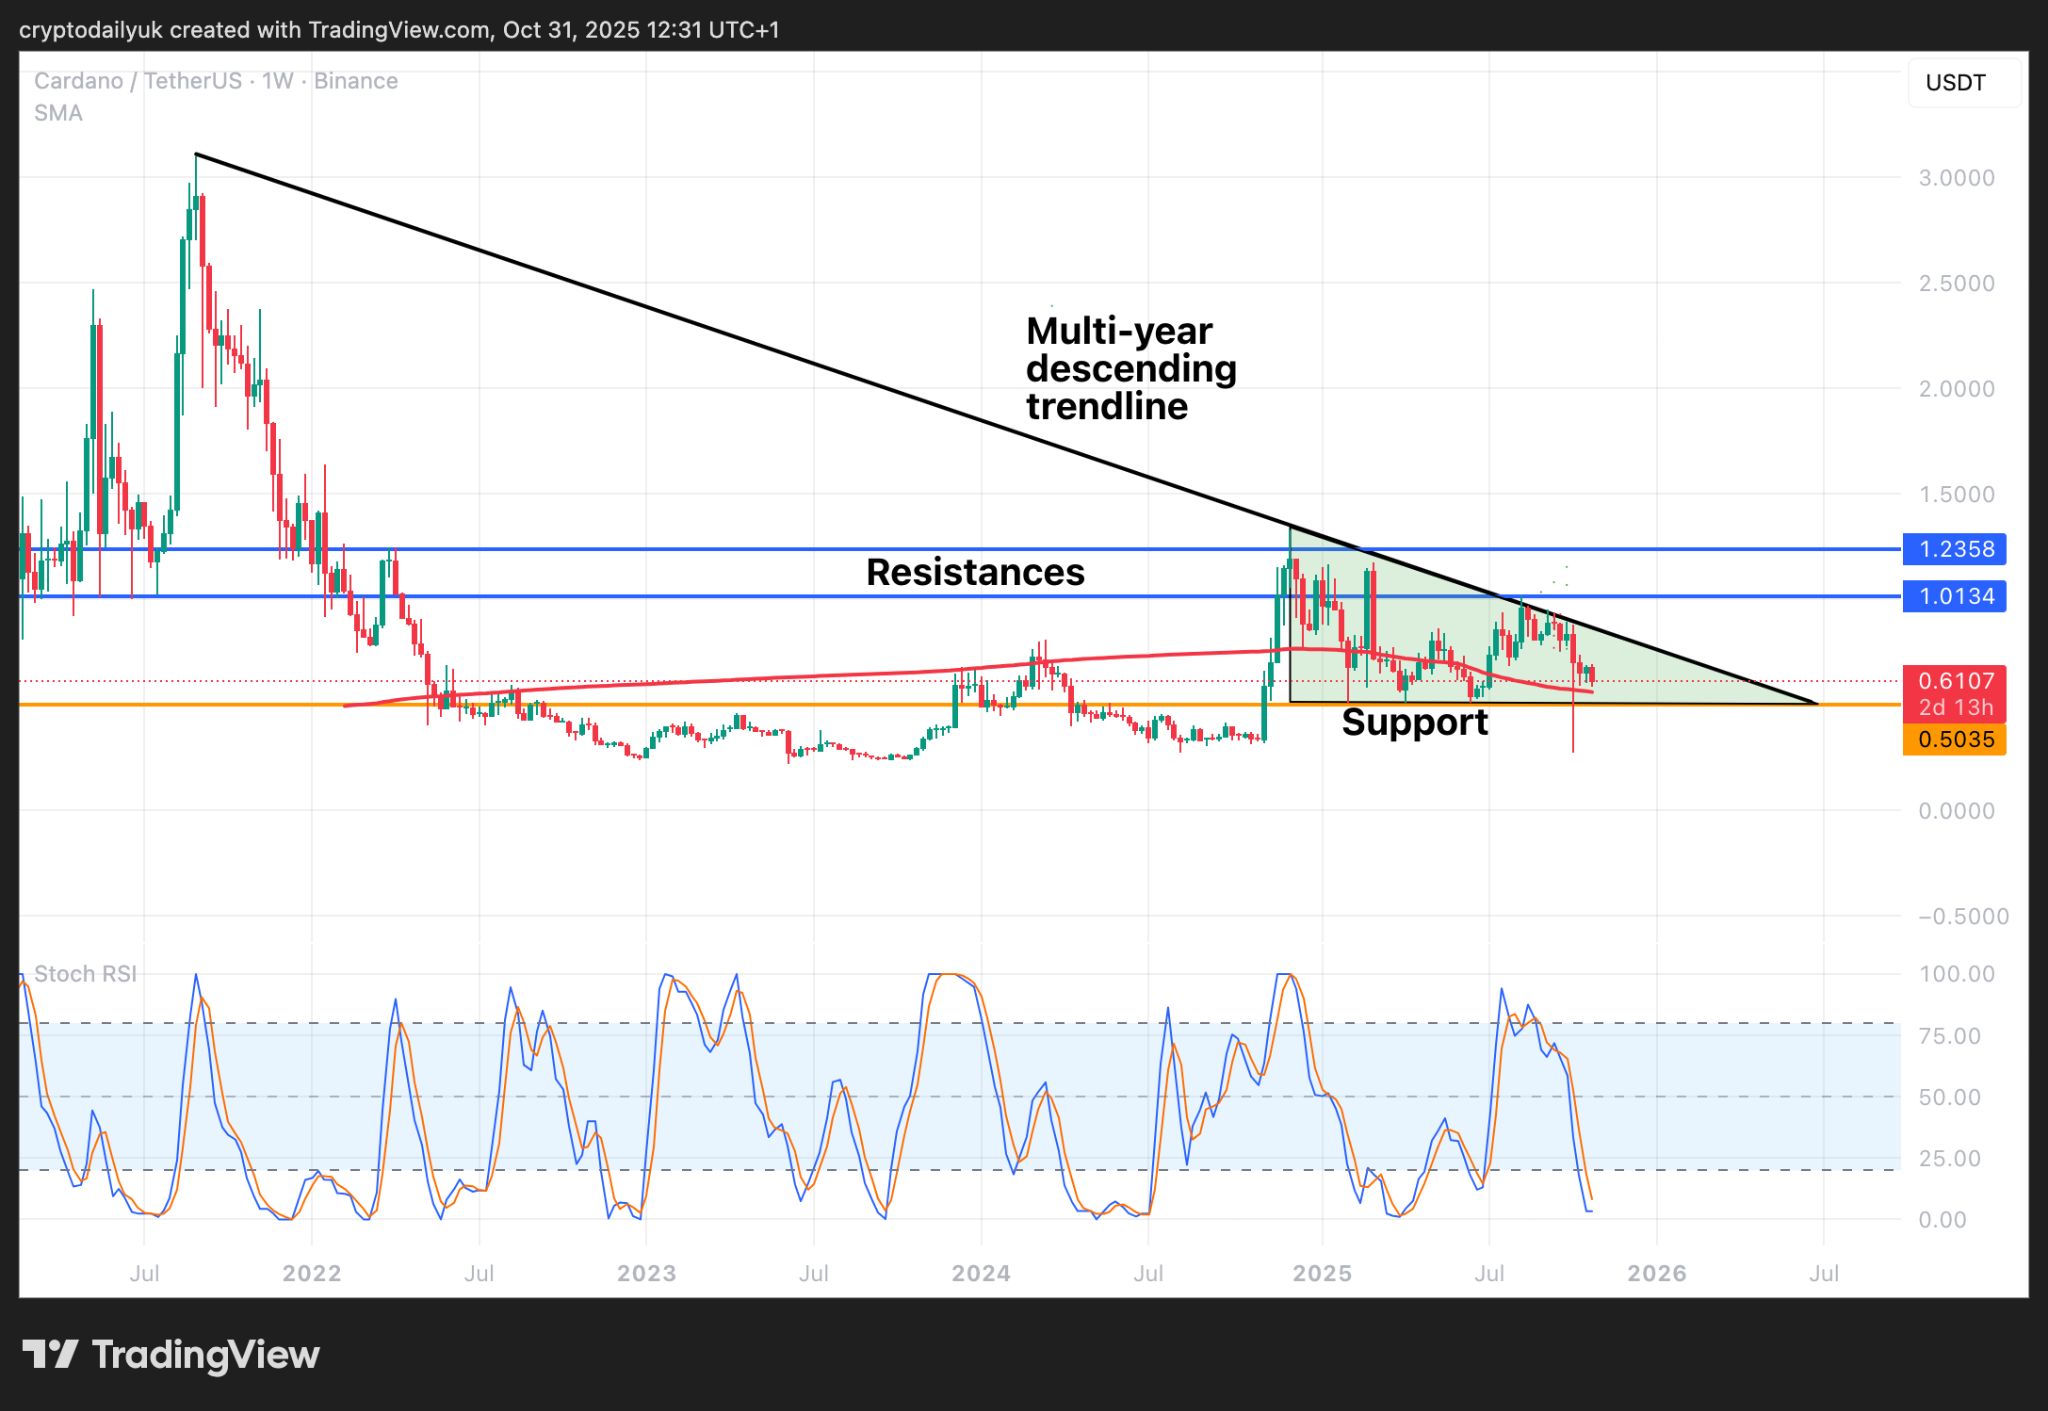
Further out into the weekly time frame the challenges to $ADA become obvious. The 200-week SMA is providing support currently, but it is sloping down now, which is a concern.
This last part of the descending trendline, and the horizontal support line under it, have formed a descending triangle. This is a bearish pattern, but it would be bullish should the price escape out of the top. Fairly solid resistances are above, so it just remains for the $ADA bulls to play their last trump card, which is the Stochastic RSI.
The Stochastic RSI indicators are hitting the bottom now. Once they are able to cross back up, and they pass the 25.00 level, some big price momentum could help to push the price out of the triangle and above the horizontal resistances. It just remains to be seen if this will indeed happen.
