
Next Pi Coin Price Move Revealed: First Bounce, Then Breakdown?

Pi Coin price may soon see a short-lived bounce as moving averages align, but fading money flow and a hidden bearish divergence suggest the rebound won’t last. Traders should watch $0.26 and $0.24 for early signs of strength or failure.
Pi Coin (PI) is testing traders’ patience again. Despite being down 7.2% over the past 24 hours, the token still holds on to 19% weekly gains — proof that some buyers are still active. But on a broader scale, the monthly chart tells a different story: Pi Coin price is still down nearly 10%, showing that the main trend hasn’t flipped yet. However, a bounce possibility has now surfaced.
The latest rebound possibility after today’s drop might look strong on the surface, but charts suggest it could just be a brief bounce before another dip. Indicators suggest a short-term setup that may lift PI prices slightly before sellers regain control.
Short-Term Crossover Could Drive a Brief Rebound
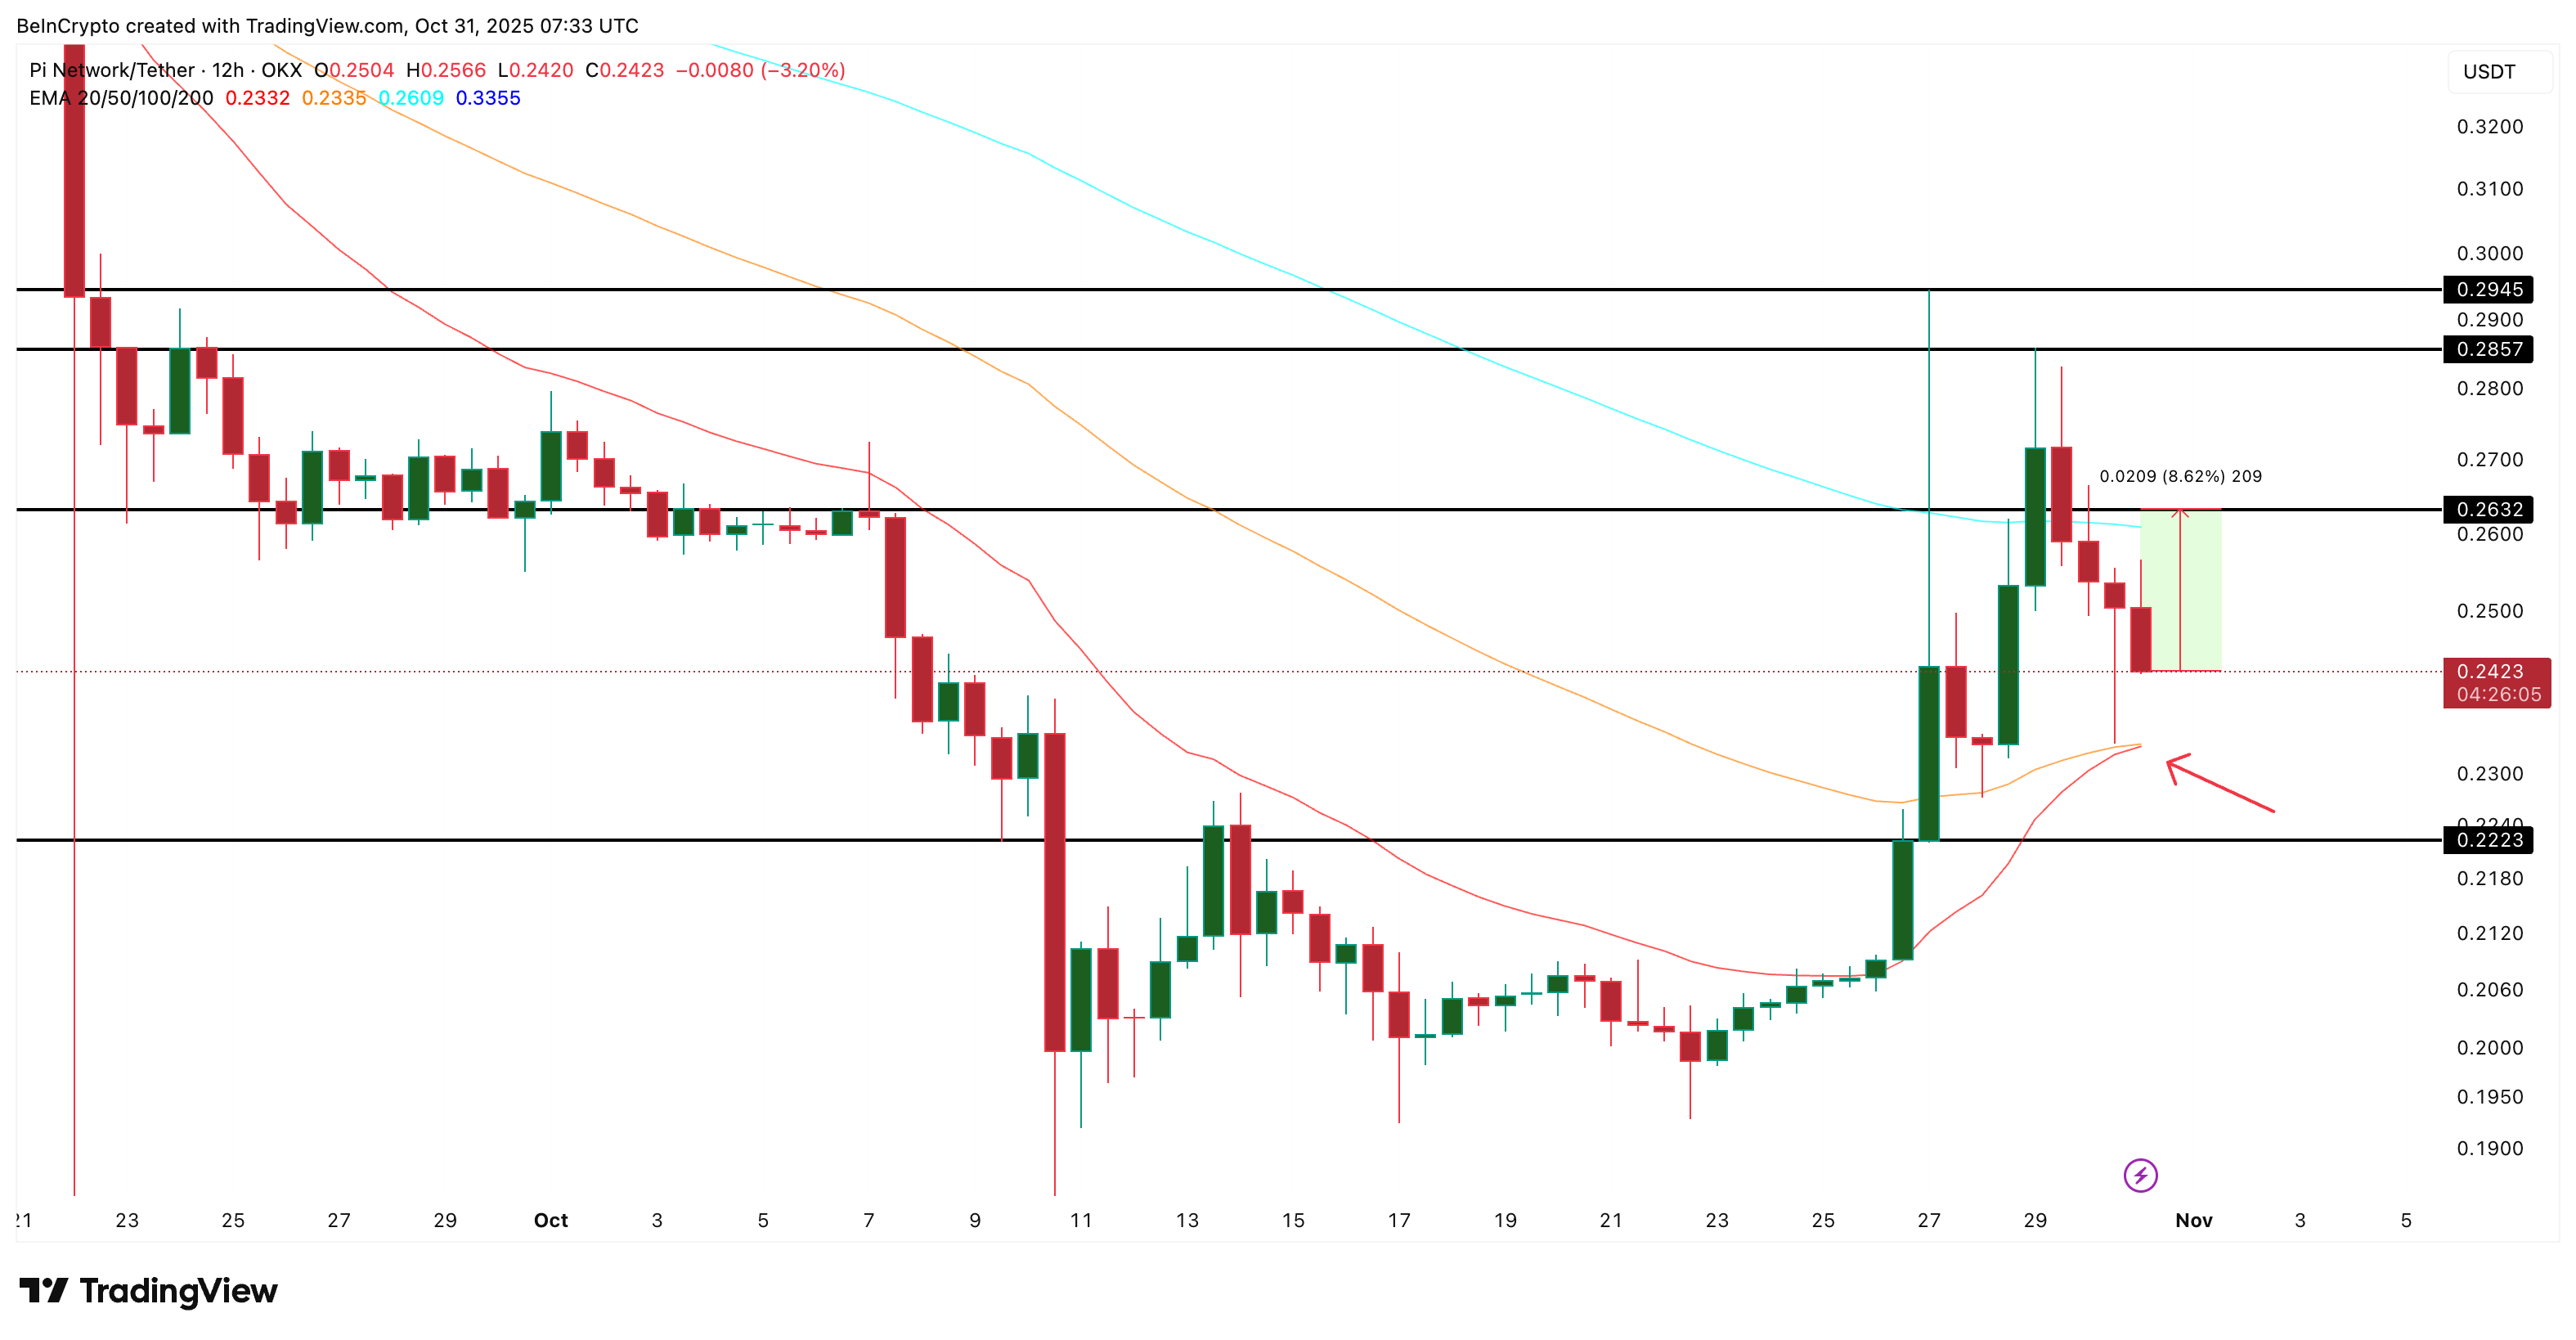
The 12-hour chart shows that Pi Coin is close to forming a short-term bullish crossover — a setup that often triggers small upward moves.
This happens when the 20-period exponential moving average (EMA) crosses above the 50-period EMA. The EMA tracks price trends over time, giving more weight to recent candles. When the faster line (20 EMA) moves above the slower one (50 EMA), it signals a shift in short-term momentum. This formation is also referred to as the “Golden” crossover.
 Golden Crossover Looms:
TradingView
Golden Crossover Looms:
TradingView
Want more token insights like this? Sign up for Editor Harsh Notariya’s Daily Crypto Newsletter here.
If that crossover completes, the Pi Coin price could rebound to $0.26–$0.29, with $0.26 marking an 8.6% upside target. Moving past $0.26 would also mean reclaiming the 100-period EMA, which could give traders a bit more confidence.
But short-term momentum alone isn’t enough. Without strong money flow or whale support, this bounce could lose steam quickly.
Weak Big-Money Inflows Make the Bounce Theory Fragile
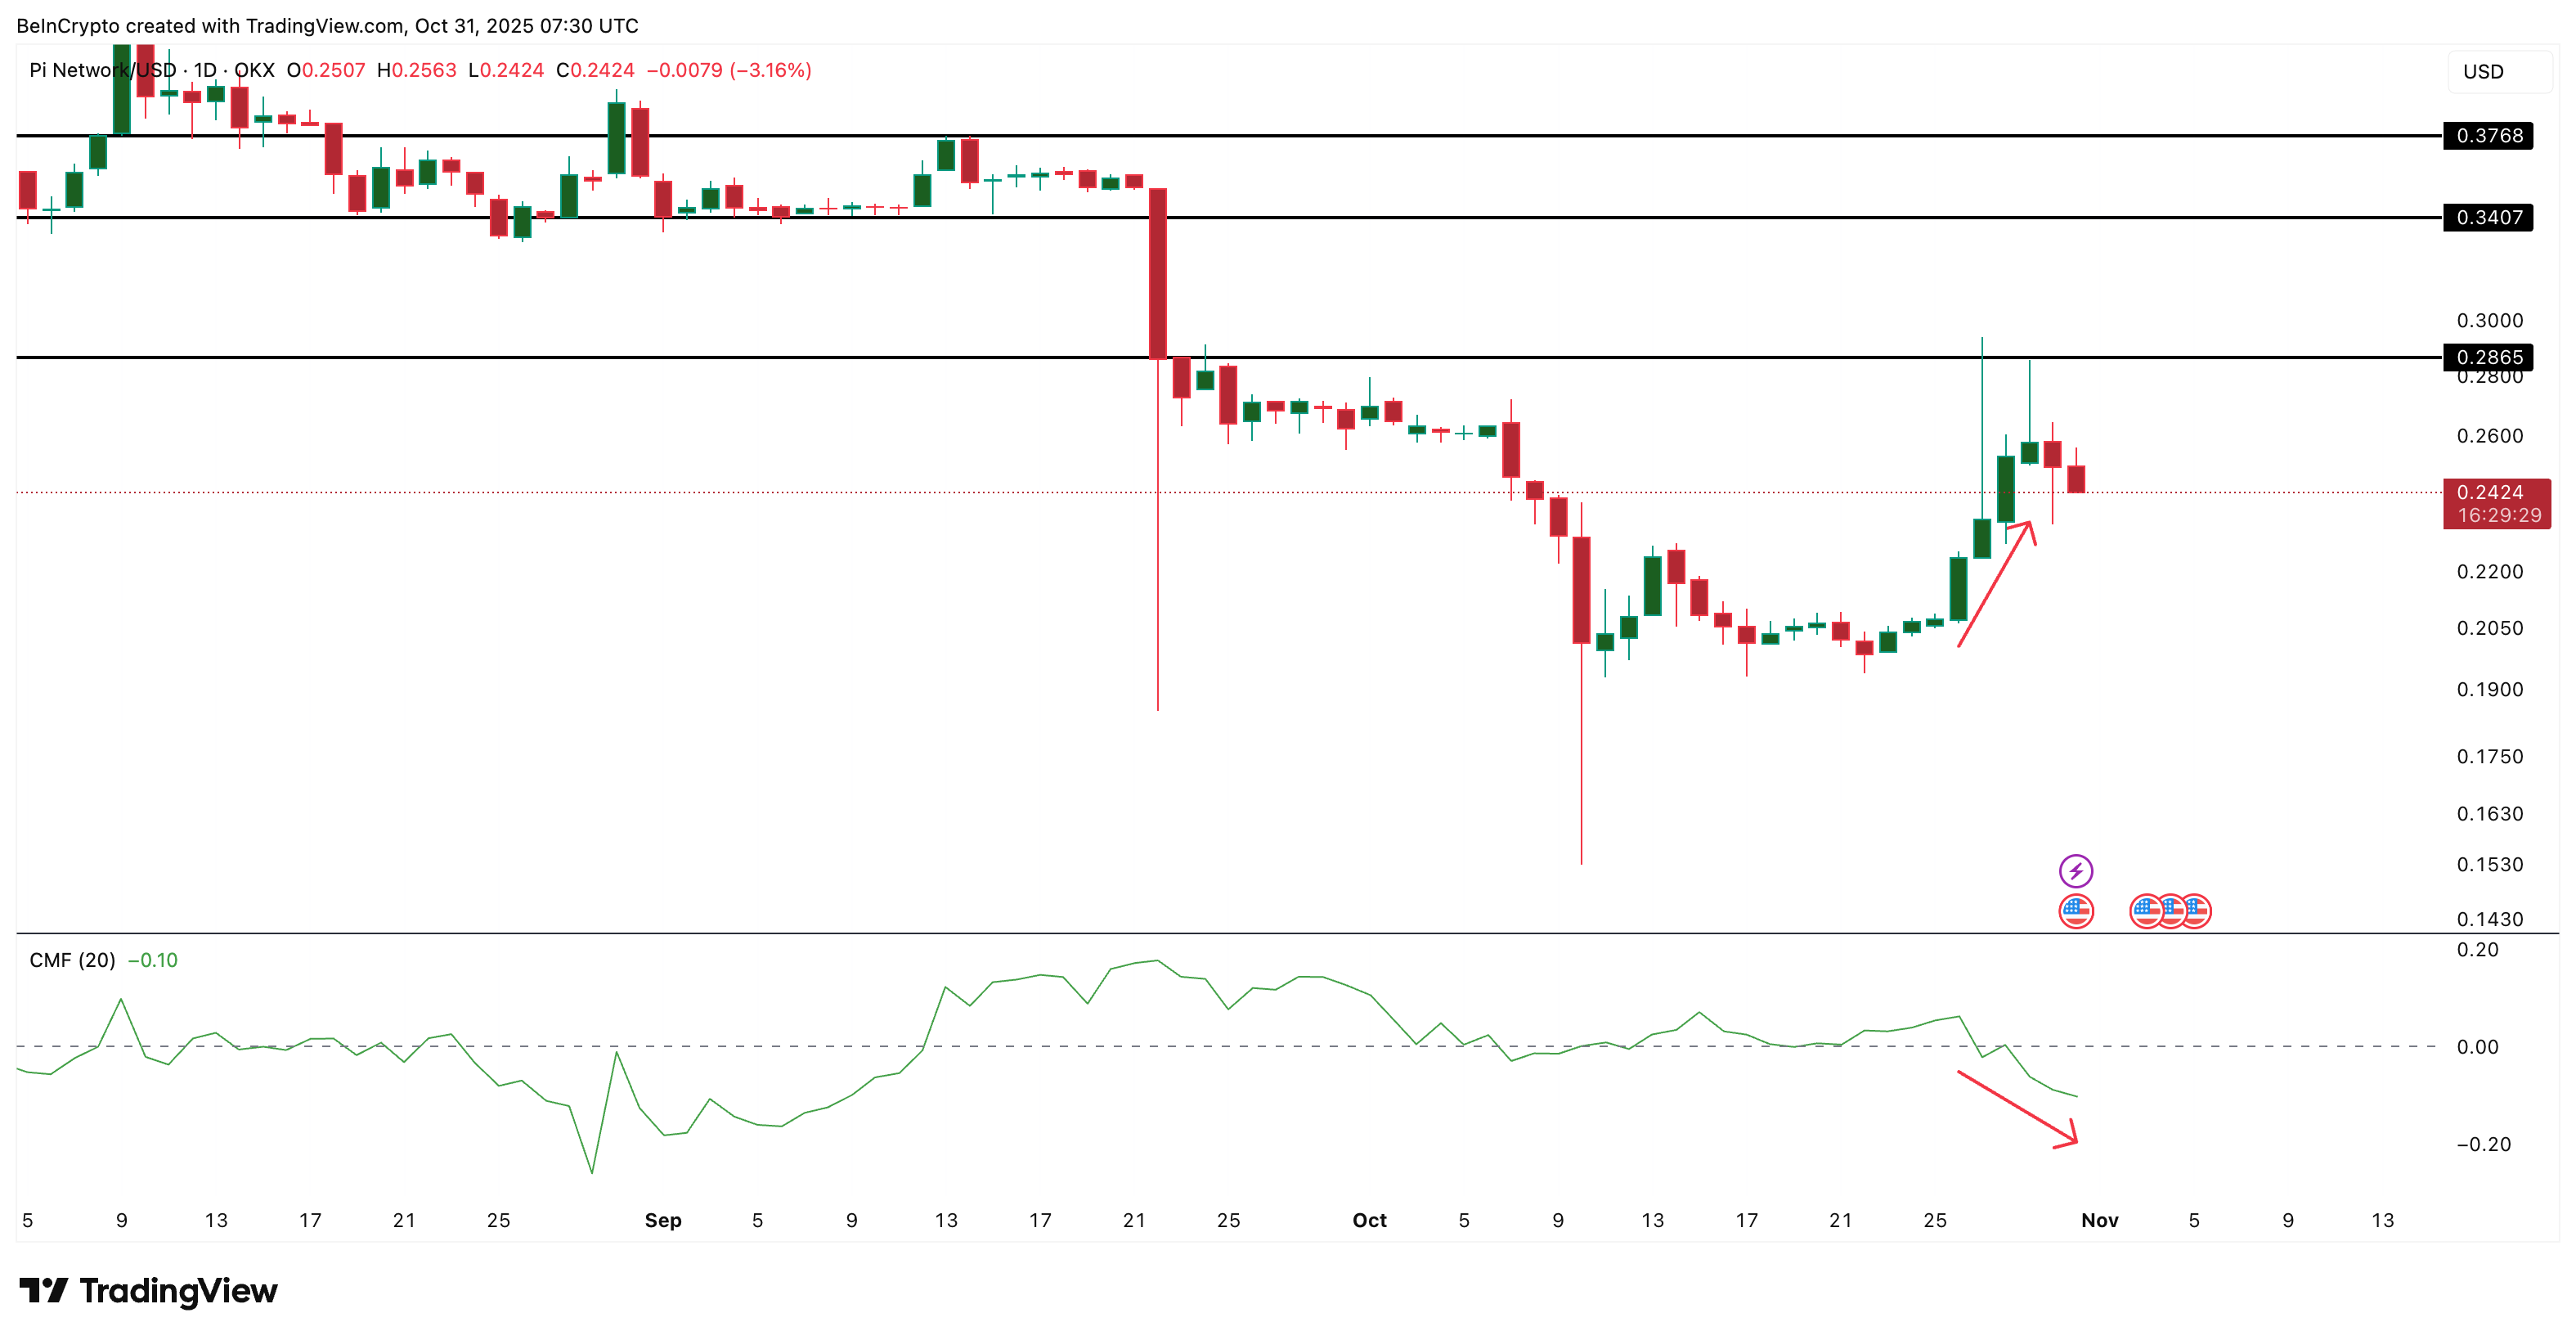
The Chaikin Money Flow (CMF) — an indicator that tracks whether big money is flowing into or out of an asset — has been falling since October 26.
Between October 26 and October 29, Pi Coin made higher lows, but the CMF line trended down and fell below zero. This divergence shows that larger wallets and institutions aren’t backing the rally. Instead, smaller traders might be driving the move.
 Pi Coin Whales Not Interested:
TradingView
Pi Coin Whales Not Interested:
TradingView
When CMF drops under zero, it usually signals that big sellers are stronger than big buyers — even if the price looks stable.
So while the EMAs suggest a bounce, the lack of whale participation limits how far that bounce can go. The Pi Coin price rally might fade near resistance, turning into a setup for the next correction.
Hidden Bearish Divergence Hints at the Next Pi Coin Price Drop
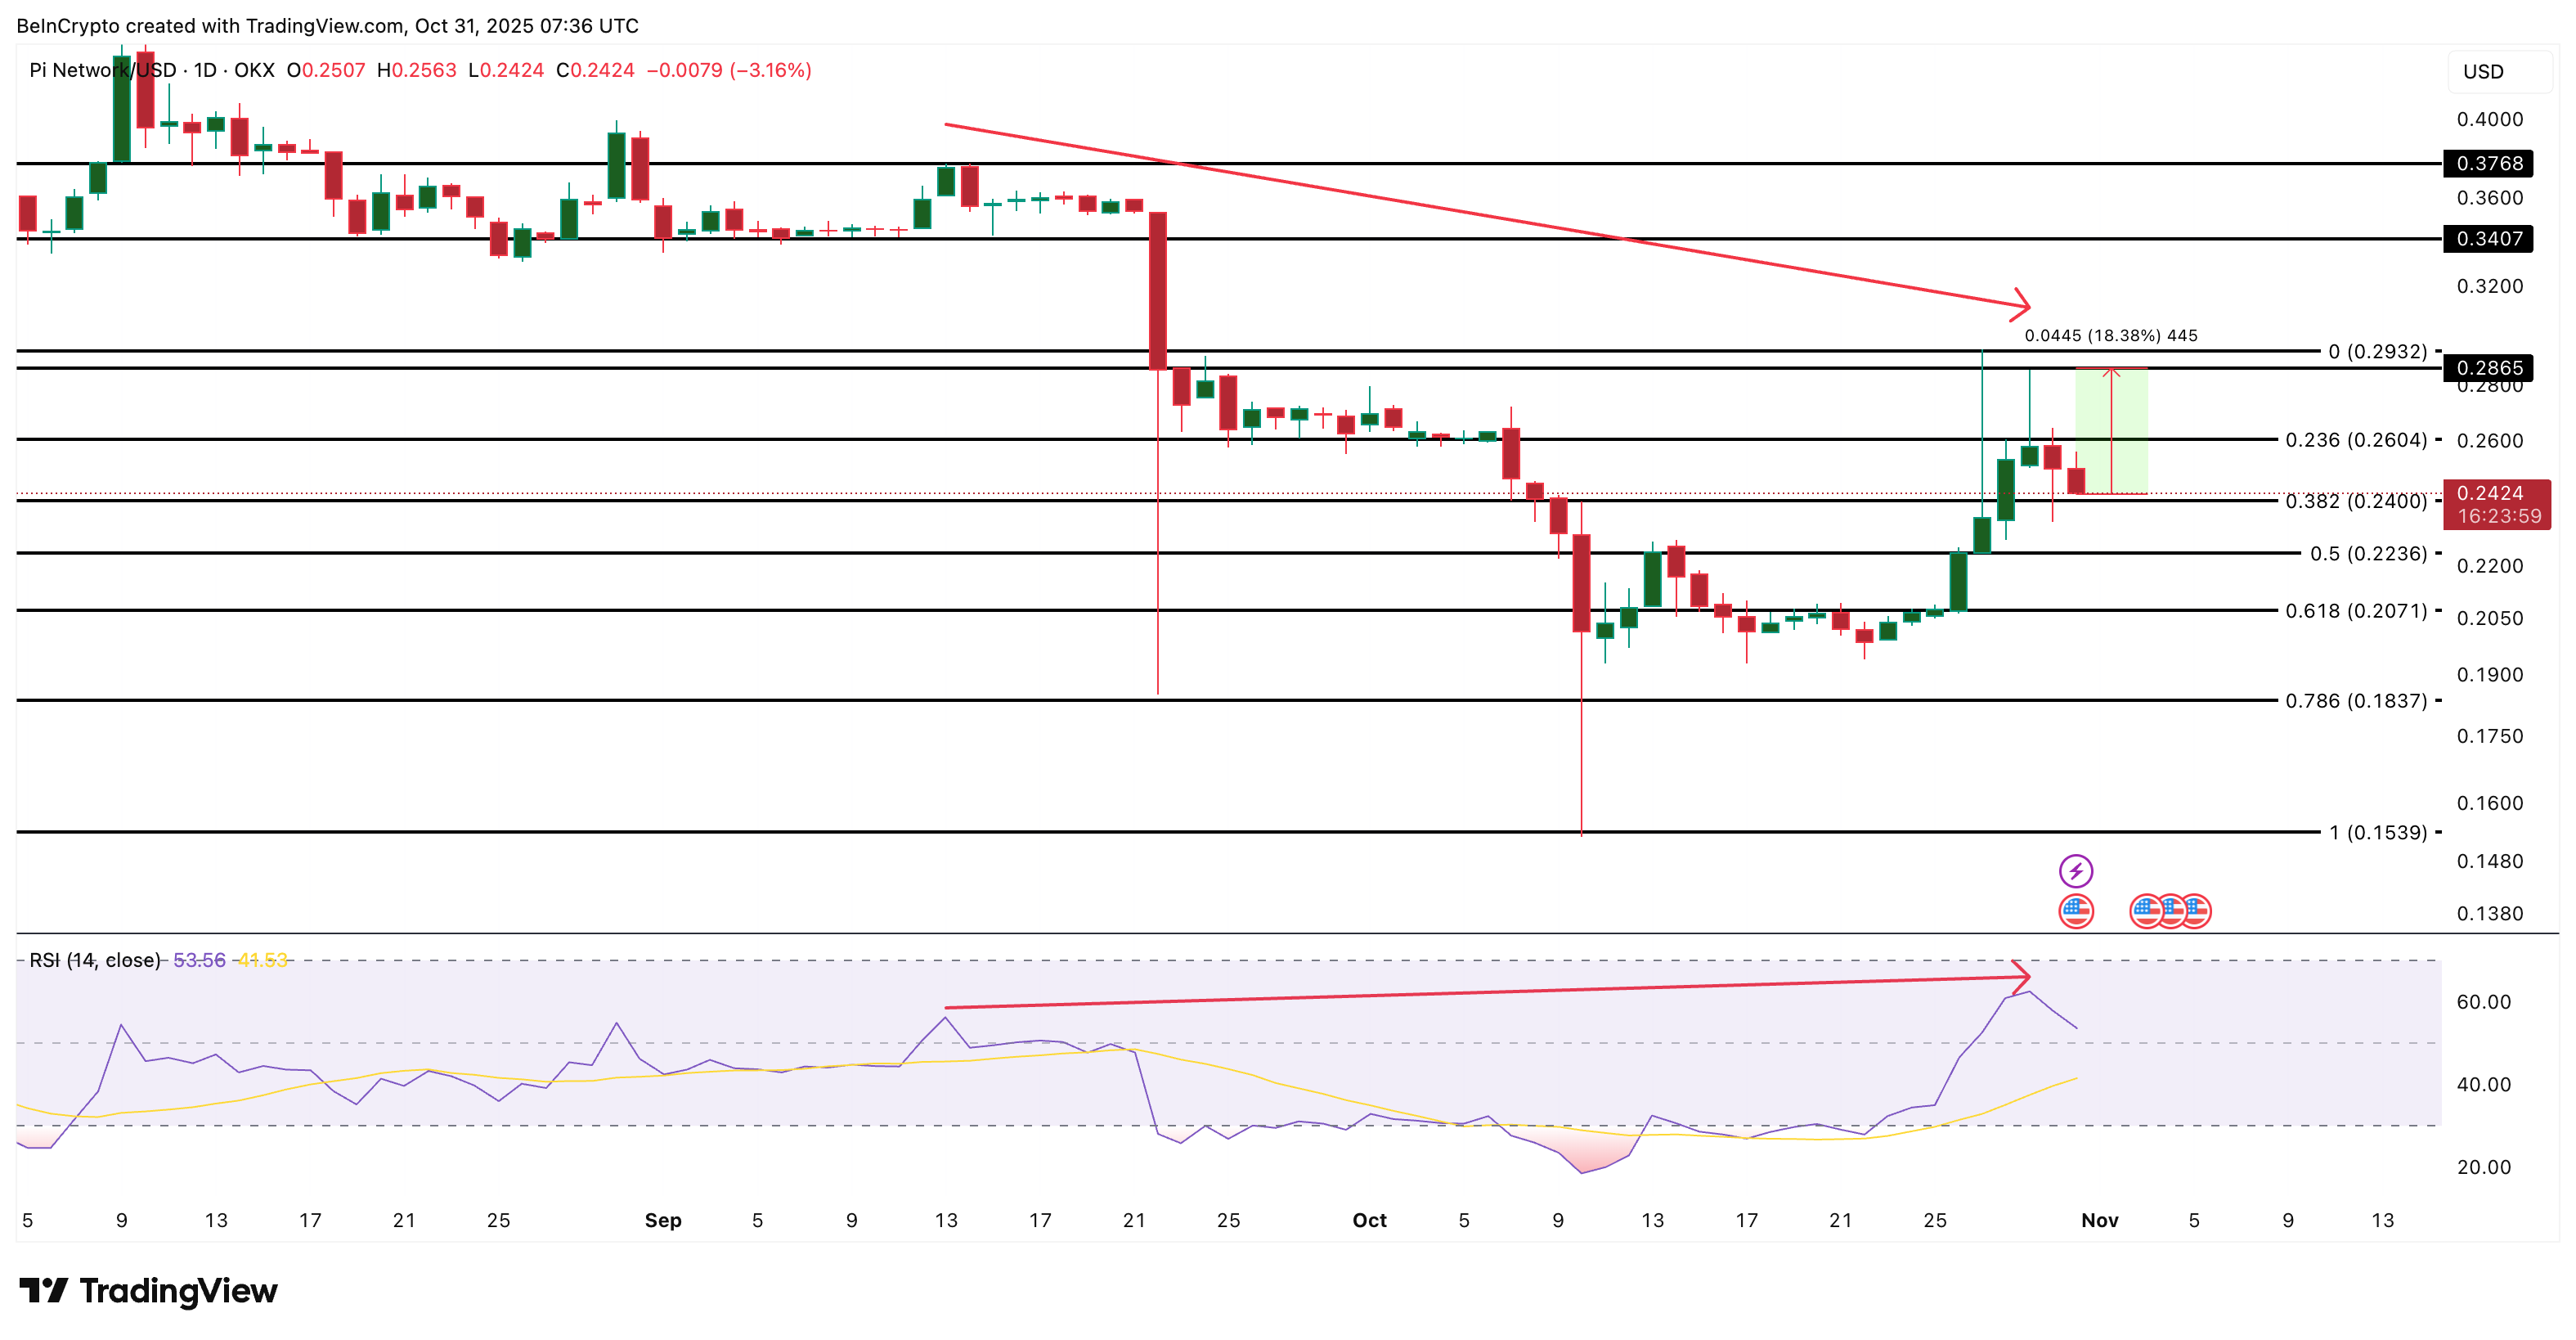
The daily PI chart shows why traders should stay cautious. Between September 13 and October 29, Pi Coin’s price made a lower high. The Relative Strength Index (RSI) — which measures buying and selling momentum on a 0–100 scale — made a higher high.
That’s a hidden bearish divergence, a technical signal that the broader downtrend may continue once the short-term bounce fades.
Pi Coin is currently trading near $0.24, sitting just above a key support. Holding that level could trigger a small rebound toward $0.26 and $0.28. Yet, losing $0.24 might send the price down to $0.22 or even $0.18.
 Pi Coin Price Analysis:
TradingView
Pi Coin Price Analysis:
TradingView
If selling pressure deepens, even $0.15 could be the next possible Pi Coin price target to the downside. However, if CMF turns back to the positive territory, while the crossover completes, the Pi Coin price bounce could get stronger. That would invalidate the bearish conclusion for the price move.
Disclaimer: The content of this article solely reflects the author's opinion and does not represent the platform in any capacity. This article is not intended to serve as a reference for making investment decisions.
You may also like
With a trading volume exceeding 515 millions, can Limitless become the top player in the prediction market?
Limitless is a high-frequency, short-duration trading ecosystem, more similar to Deribit or Binance than Polymarket, but operates entirely on-chain.

Central Bank of Malaysia releases three-year roadmap to pilot asset tokenization projects.
Top 5 Cryptocurrency Predictions for 2026: Crossing Cycles and Breaking Boundaries
The End of the Four-Year Cycle: Five Major Disruptive Trends in Cryptocurrency by 2026.