HBAR Price Shows Cracks — Yet a Quick Rebound May Be Hiding in the Charts

The HBAR price remains weak, weighed down by big-money outflows, but charts hint at a short-term rebound setup. If HBAR can reclaim $0.204, a quick recovery could follow before sellers regain control.
The HBAR price has come under pressure again, falling 3.2% in the past 24 hours to trade around $0.195. While most large-cap tokens have traded flat, Hedera stands out as sellers try to erase last week’s 12.7% gain.
The overall structure remains weak, but one shorter-term setup on the charts suggests that a small rebound may be forming before the next significant move. Do note that the big move isn’t expected to be bullish, yet!
Daily Chart Confirms Weak Structure, Driven by Big Money
HBAR’s daily price chart signals clear exhaustion. Between October 6 and October 31, the price made lower highs, while the Relative Strength Index (RSI) formed higher highs.
This pattern, called a hidden bearish divergence, usually signals that the broader downtrend is likely to continue.
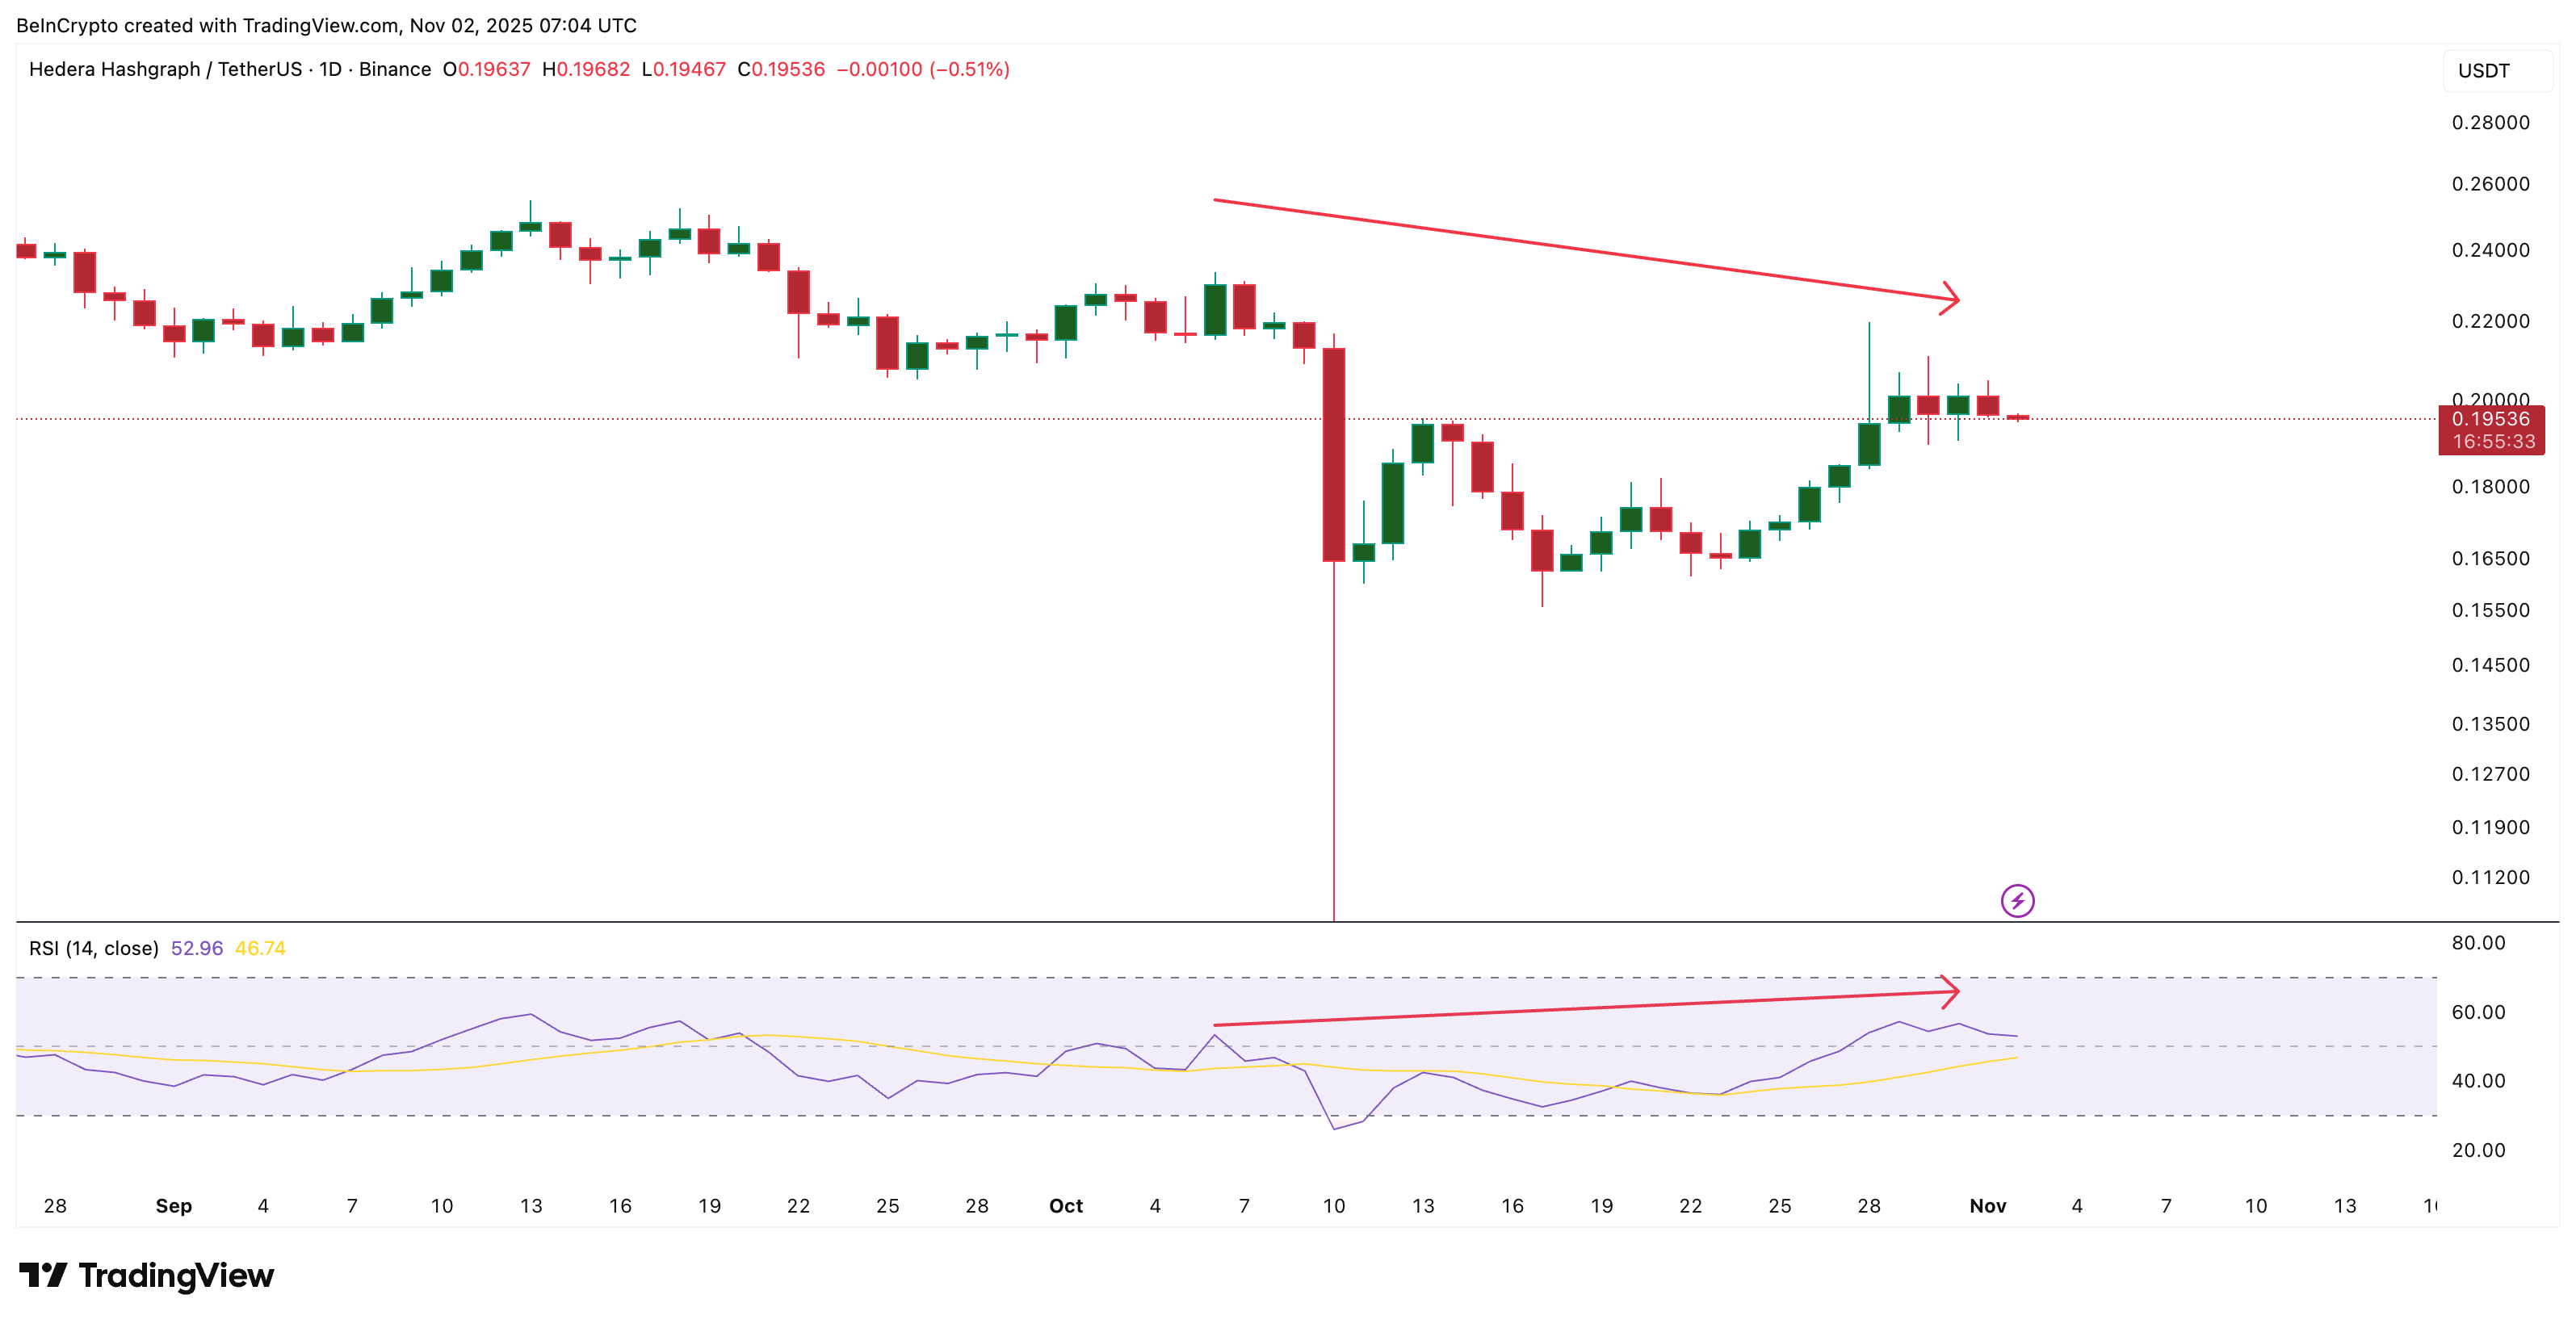 HBAR Price Flashes Bearishness (Daily Timeframe):
TradingView
HBAR Price Flashes Bearishness (Daily Timeframe):
TradingView
RSI measures buying versus selling strength, and this divergence shows buyers are losing control even as the price attempts small recoveries.
Want more token insights like this? Sign up for Editor Harsh Notariya’s Daily Crypto Newsletter.
The HBAR price, despite being in the green zone, continues to remain weak week-on-week. It is down almost 13%, month-on-month, which validates the downtrend.
The Chaikin Money Flow (CMF) — an indicator that tracks where capital is flowing — confirms this view. Since October 28, CMF has been making lower highs and has now dropped below zero to –0.09, showing consistent outflows of large money from HBAR.
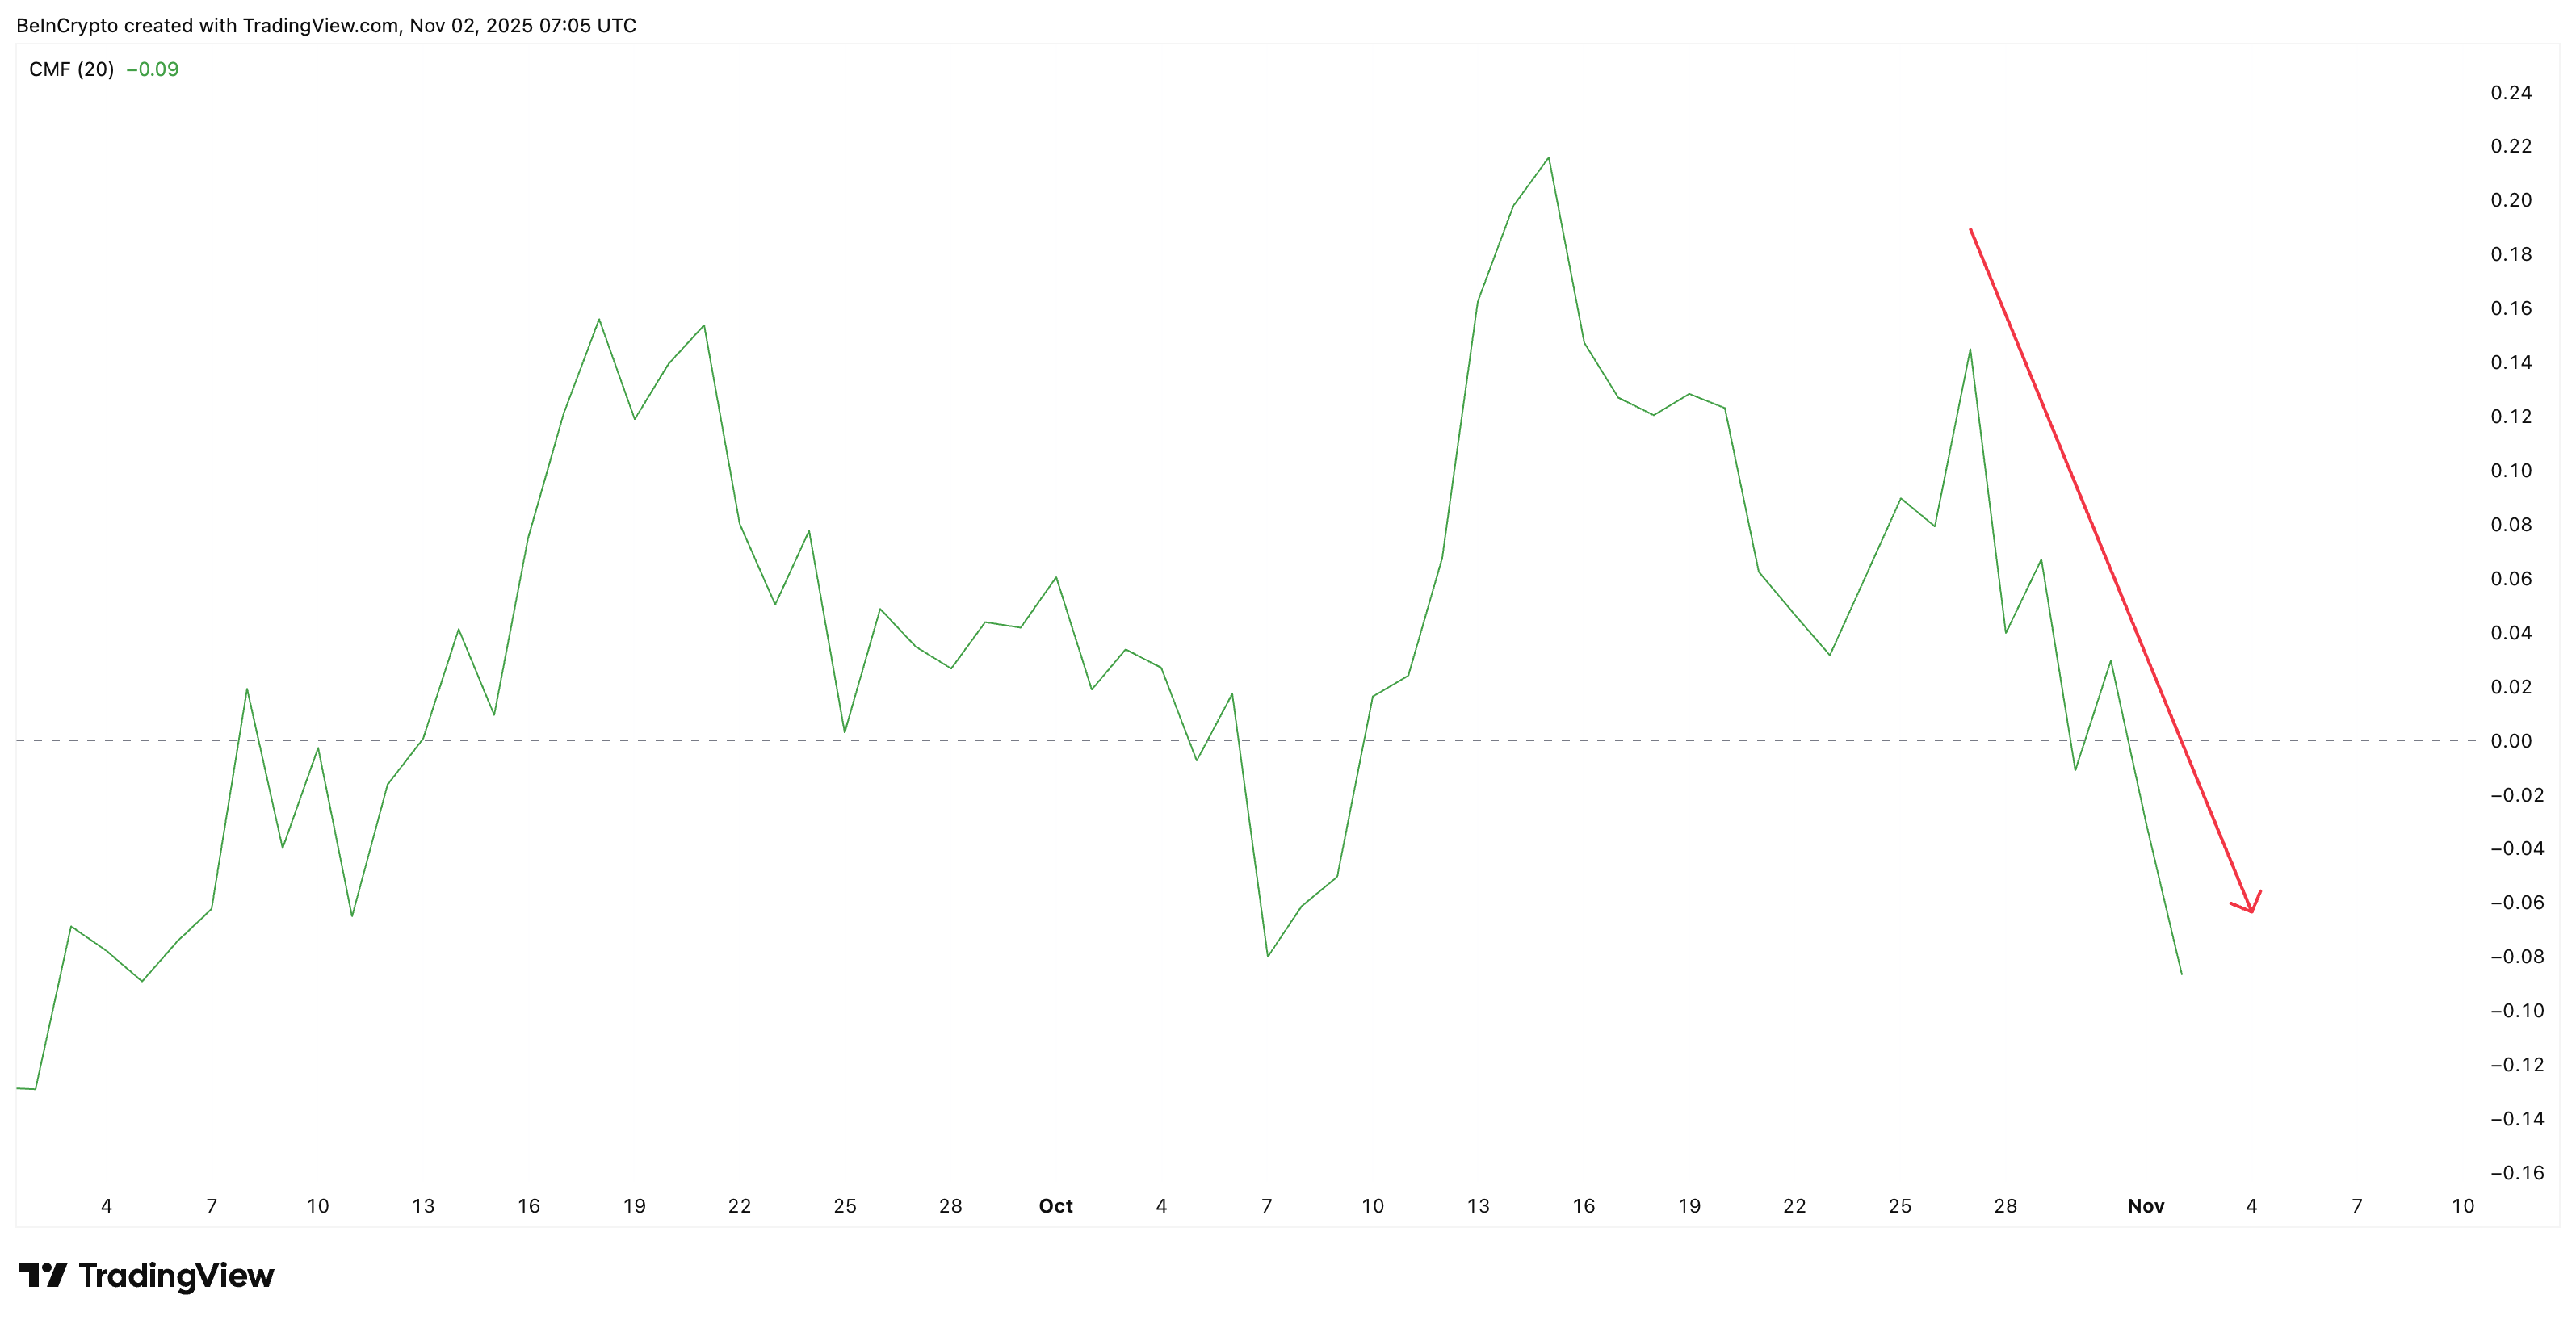 Big Money Dumping:
TradingView
Big Money Dumping:
TradingView
This pattern means institutional investors and big holders are exiting, building the selling pressure that has kept HBAR underperforming.
Lower Timeframe Hints at a Short-Term HBAR Price Rebound Window
Despite the bearish structure, the 4-hour Hedera (HBAR) chart offers a hint of near-term relief. Between October 31 and November 2, HBAR’s price made a higher low, while RSI made a lower low — a hidden bullish divergence that often appears before quick rebounds in weak markets.
This doesn’t reverse the broader trend, but it shows that short-term buyers might be stepping in. If HBAR manages a clean close above $0.204, a level that has faced repeated failures since October 30, it could trigger a brief rebound toward $0.219, the next resistance zone.
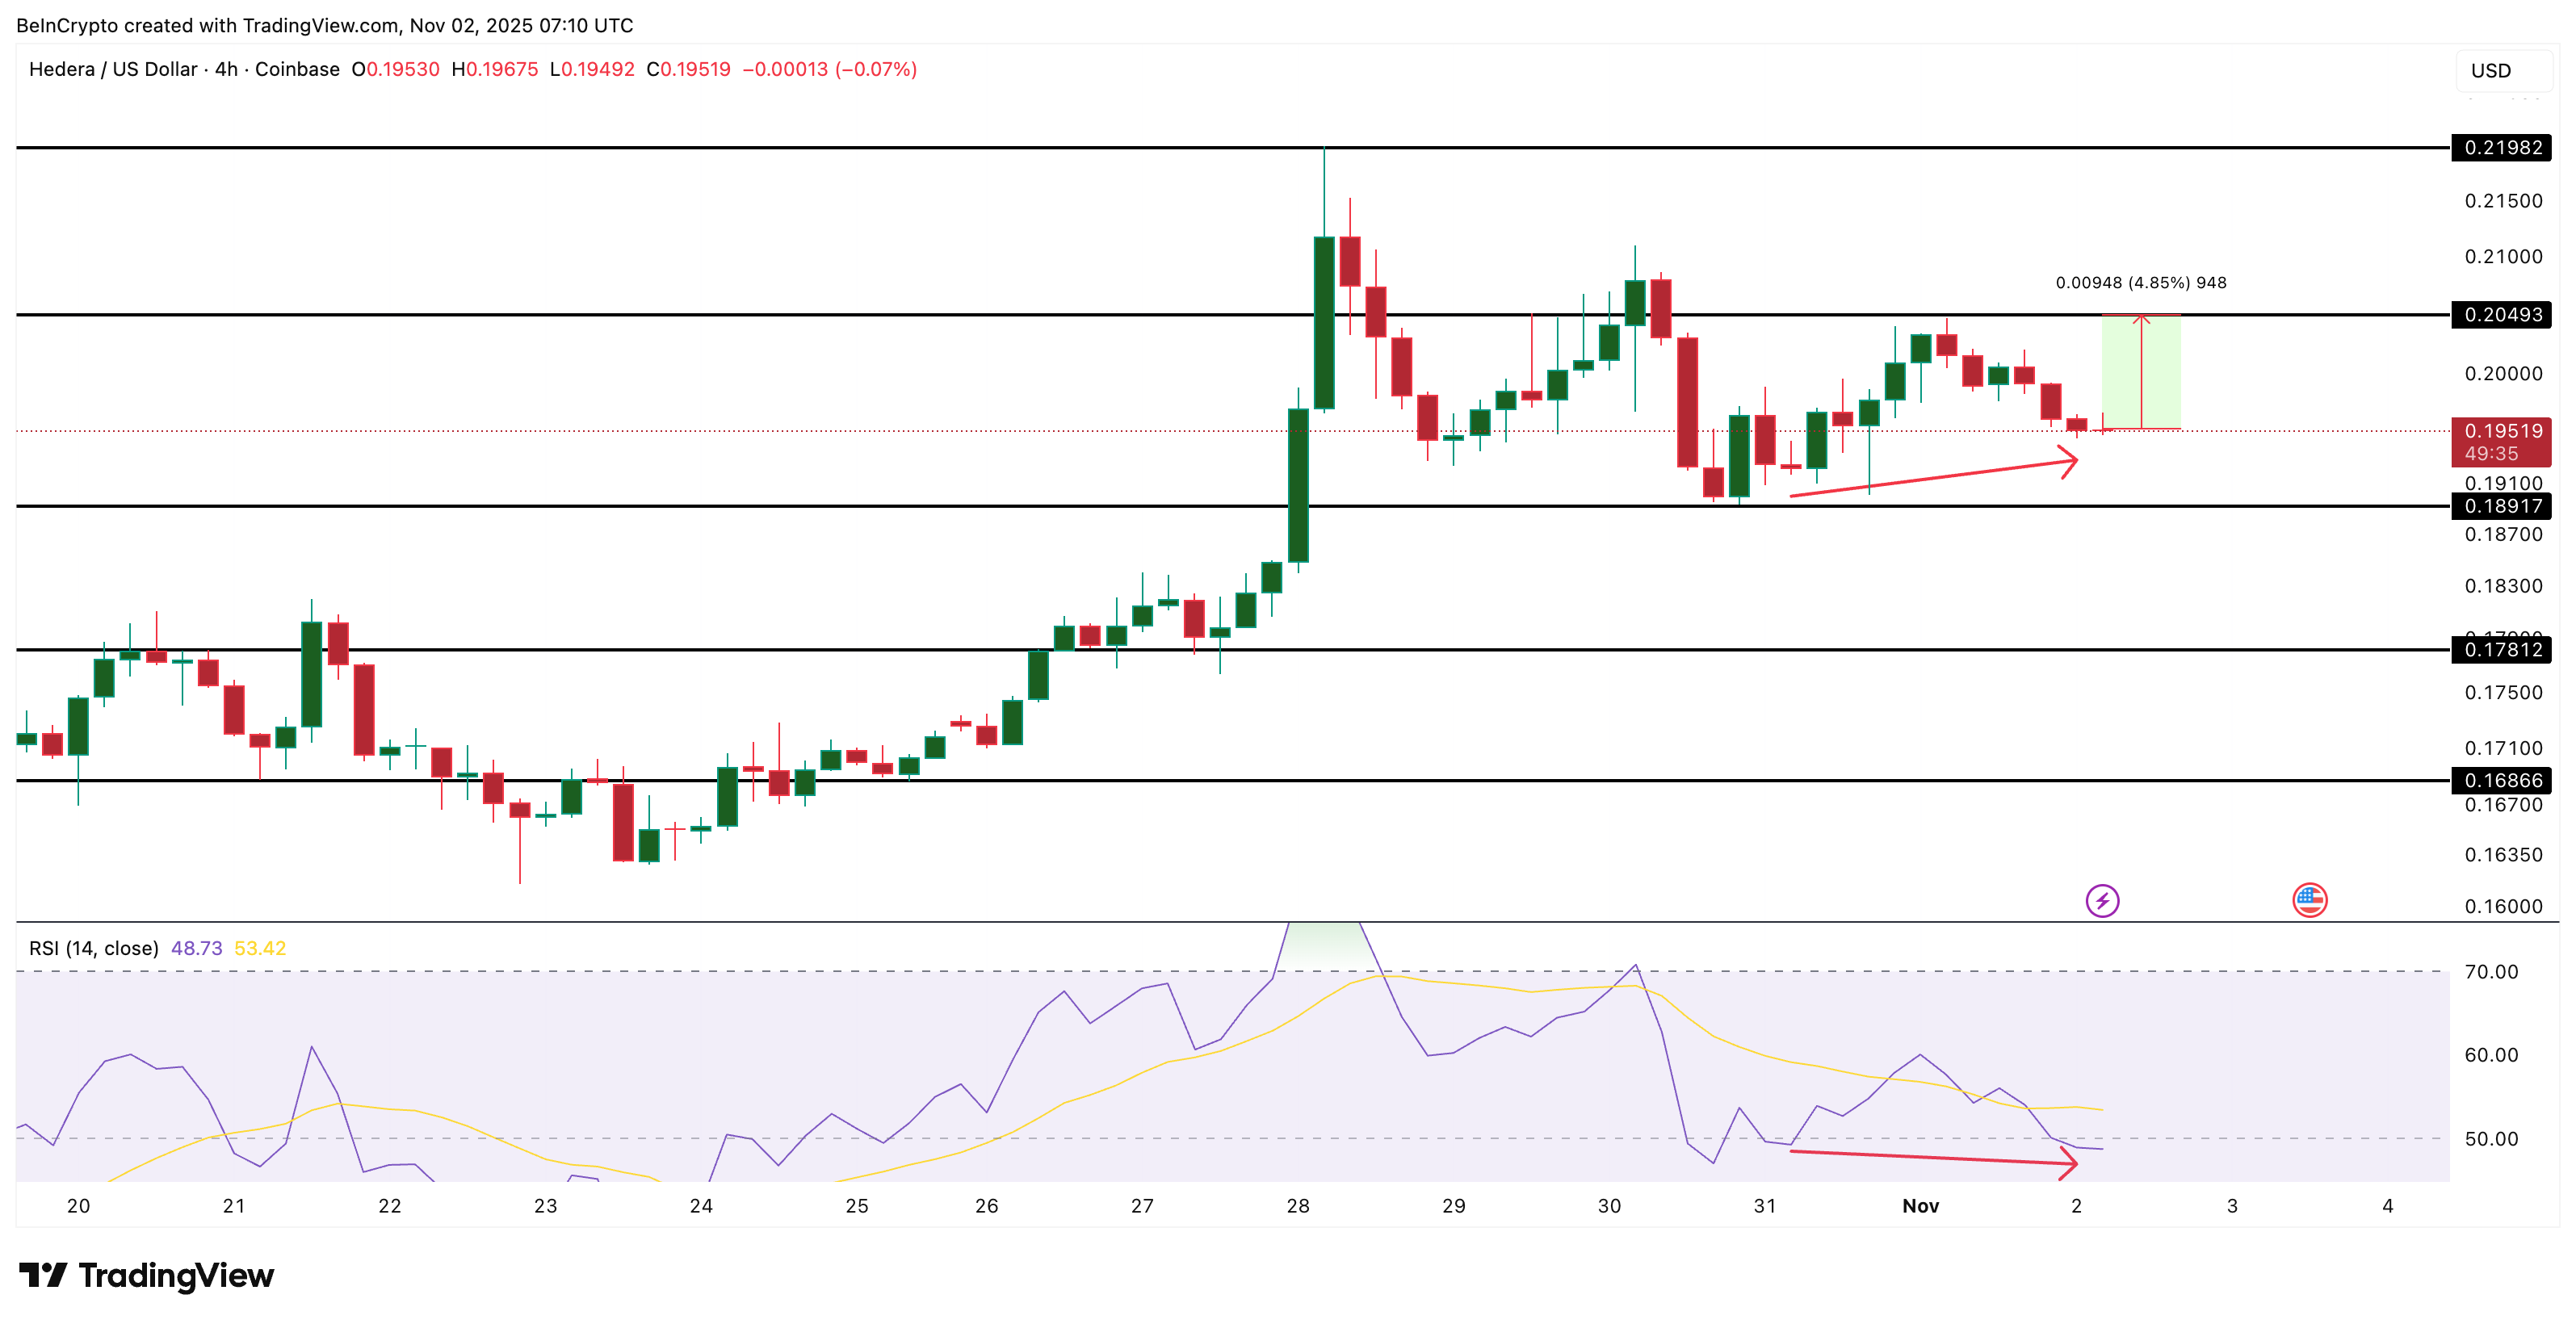 HBAR Price Analysis:
TradingView
HBAR Price Analysis:
TradingView
However, if the move fails and prices fall under $0.189, further declines toward $0.178 and $0.168 could follow. A daily close below $0.168 would invalidate any rebound setup, confirming that the downtrend remains firmly in control.
Disclaimer: The content of this article solely reflects the author's opinion and does not represent the platform in any capacity. This article is not intended to serve as a reference for making investment decisions.
You may also like
Goldman Sachs predicts that the "U.S. government shutdown" will end within two weeks, making a Federal Reserve rate cut in December "more justified"?
Goldman Sachs predicts that the government shutdown is "most likely to end around the second week of November," but also warns that key economic data will be delayed.
I traded perpetual contracts for a month: from dreaming of getting rich overnight to a sobering reality.
Find a group of people who are doing the same thing as you, preferably those who are smarter than you.

Solana Consolidates Above $177 Support as Market Watches $200 Breakout Level

BTC Dominance Faces 60% Barrier Before Next Halving Cycle