Ethereum Price Takes a Hit as Holders Dump — But Is the Weakness Temporary?

Ethereum price slipped 3.8% to $3,738 after holders cut exposure, triggering short-term selling pressure. But a strong on-chain support zone and hidden bullish signals on the daily chart suggest this dip could be temporary, keeping the broader uptrend intact.
Ethereum price has stumbled into November with renewed selling. The price dropped 3.8% in the past 24 hours, falling near $3,738, after a rough October that saw losses of almost 17%. The market had hoped for a rebound, but data now show holders reducing exposure.
Still, on-chain support zones and a key momentum signal suggest the dip may not last for long.
Holders Pull Back, But On-Chain Support Remains Strong
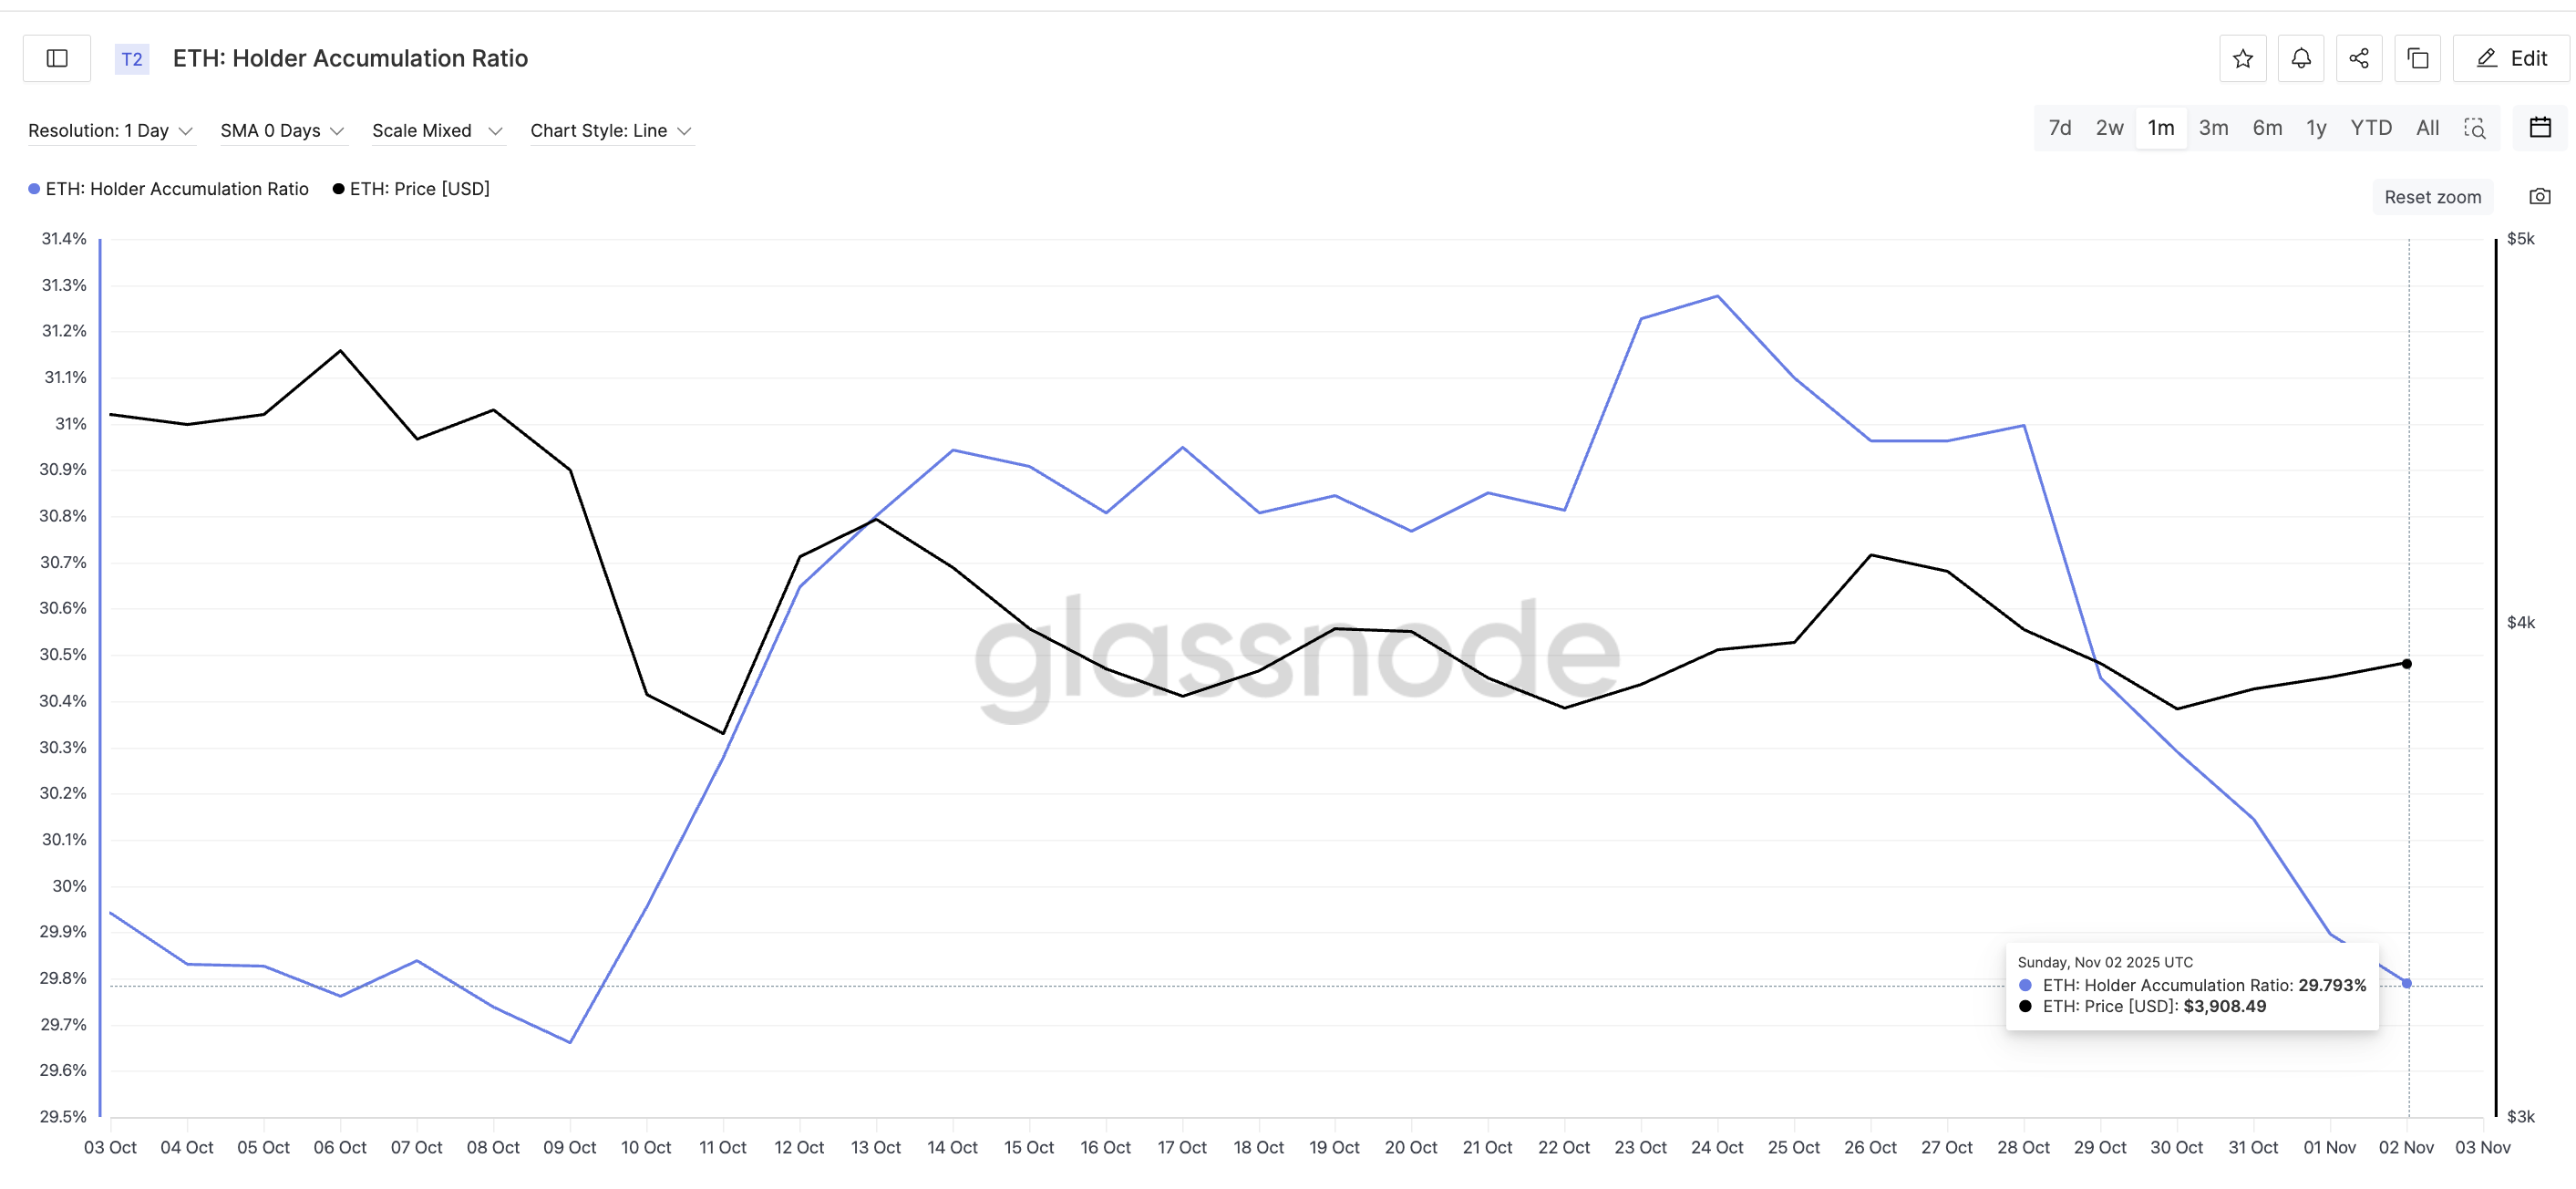
The holder accumulation ratio — which measures how much existing Ethereum wallets are adding to their balances — has slipped to 29.79%, its second-lowest level in a month. The last similar drop, on October 9 (29.66%), triggered a 14% fall from $4,370 to $3,750.
Want more token insights like this? Sign up for Editor Harsh Notariya’s Daily Crypto Newsletter.
 Ethereum Holders Dump:
Glassnode
Ethereum Holders Dump:
Glassnode
This decline suggests long-term holders are trimming exposure or waiting for better prices. The death cross predicted last week — when Ethereum’s short-term moving average crossed below the long-term one — has also taken shape, confirming that sellers briefly have the upper hand.
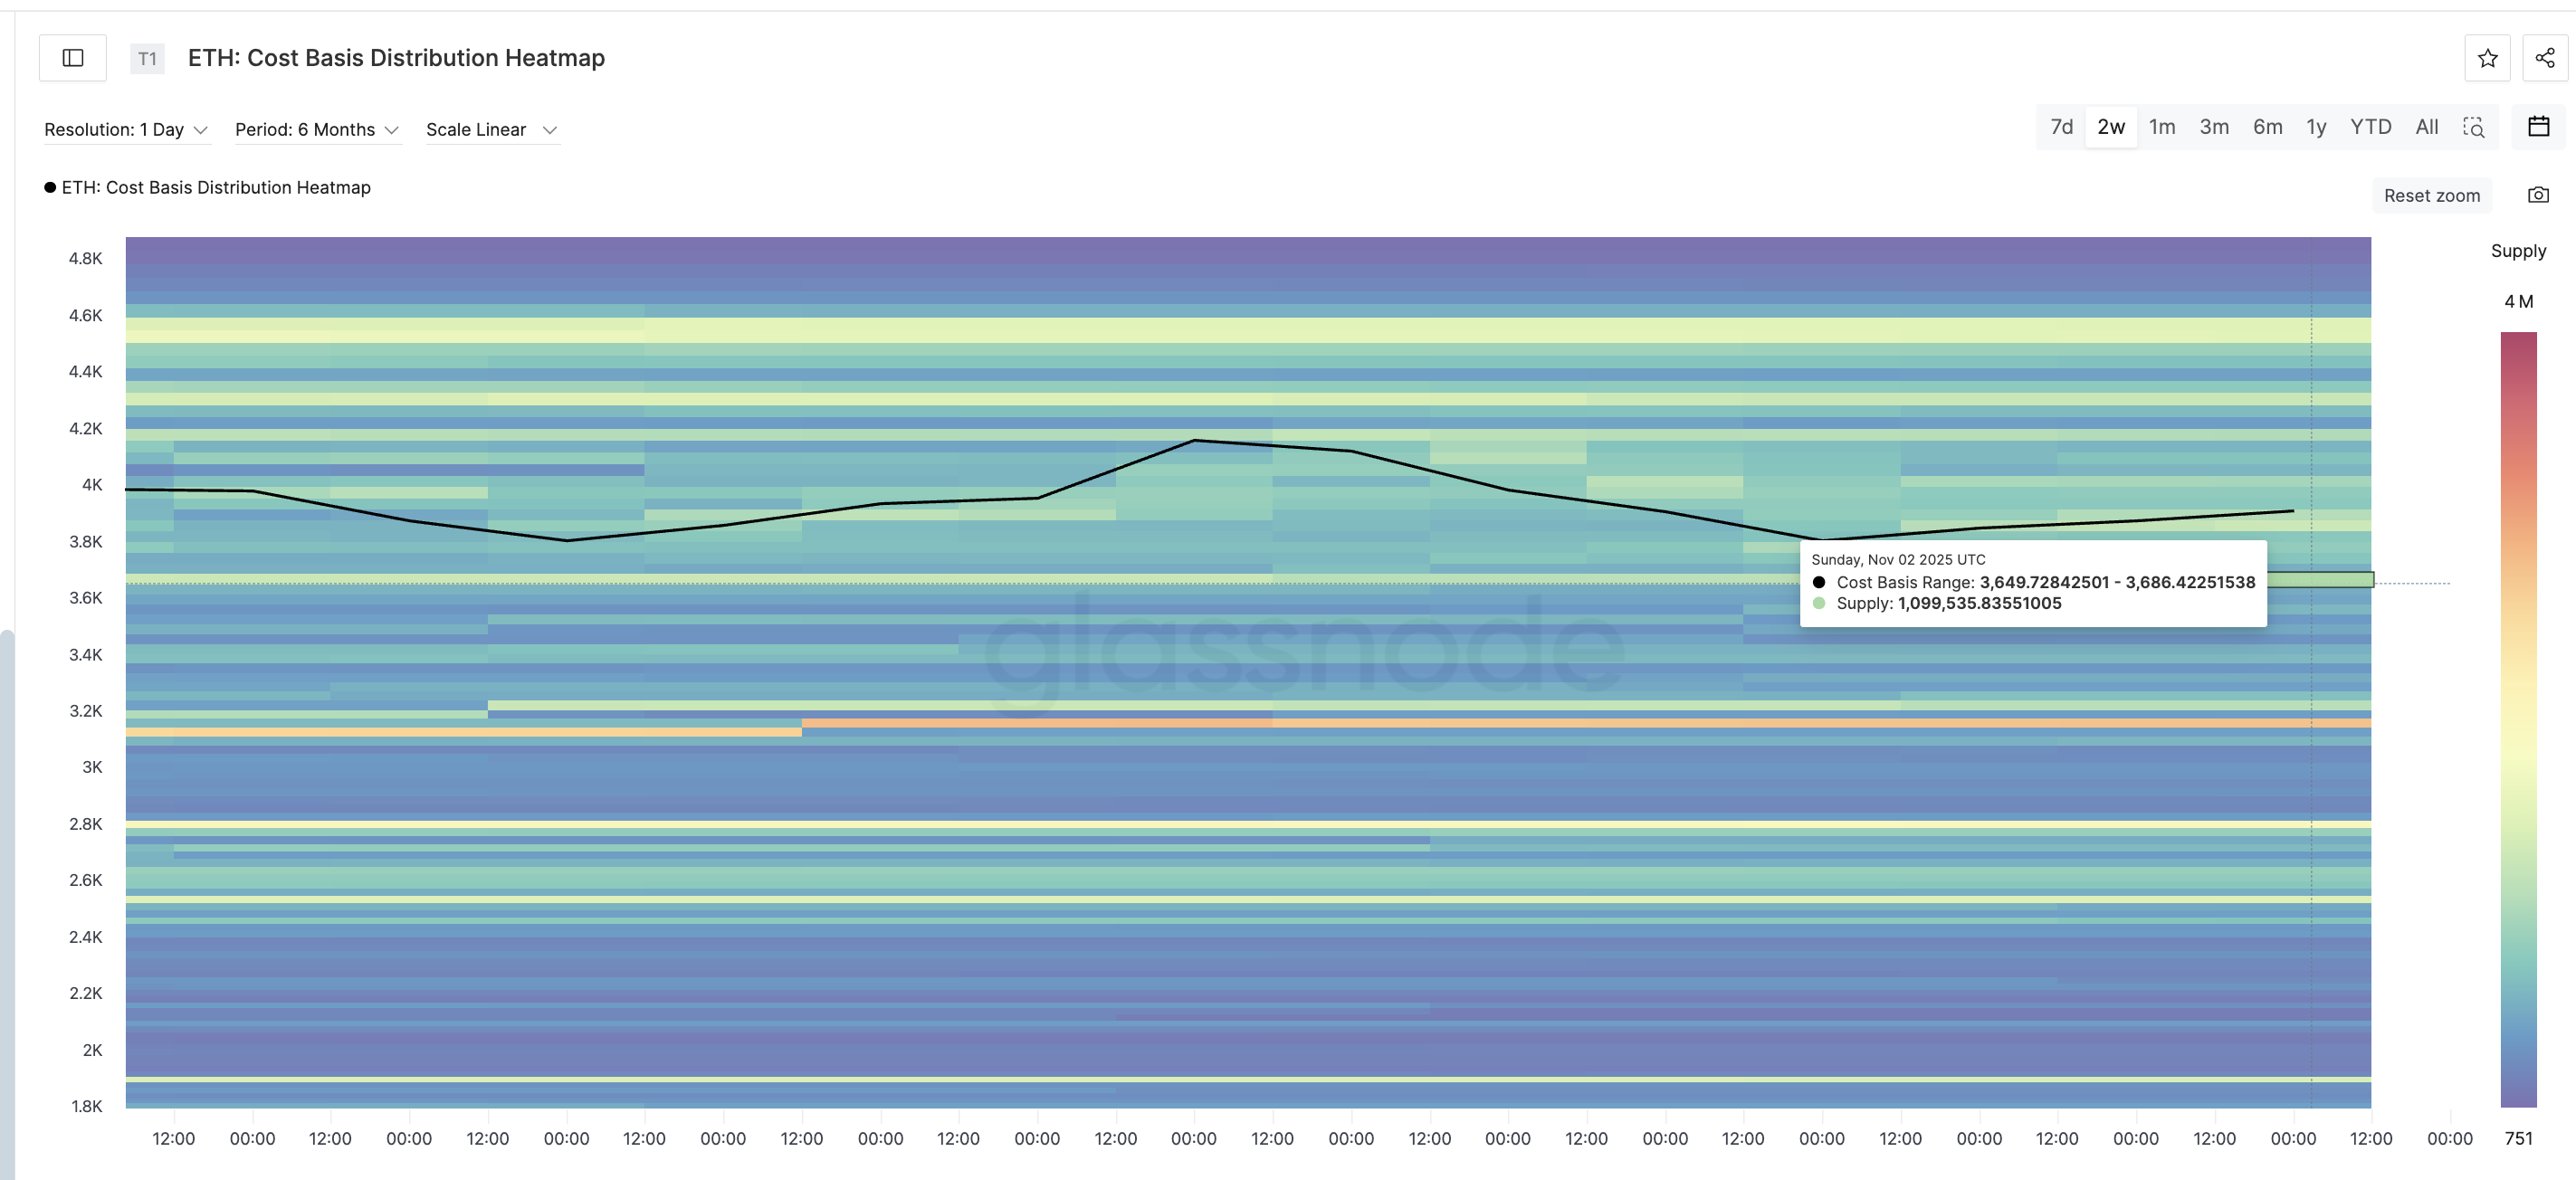
However, data from the cost basis distribution heatmap shows a strong support cluster between $3,649 and $3,686, where about 1.09 million ETH were last transacted.
 Accumulation Zone Could Act As Support:
Glassnode
Accumulation Zone Could Act As Support:
Glassnode
The Cost-Basis Heatmap shows the price levels where investors last bought their coins. It helps identify key support or resistance zones based on past holder activity.
Such dense accumulation often acts as a cushion, meaning that if the Ethereum price slides further, this region could trigger dip-buying interest and limit deeper losses.
Bullish Divergence and Ethereum Price Action Hint at Possible Rebound
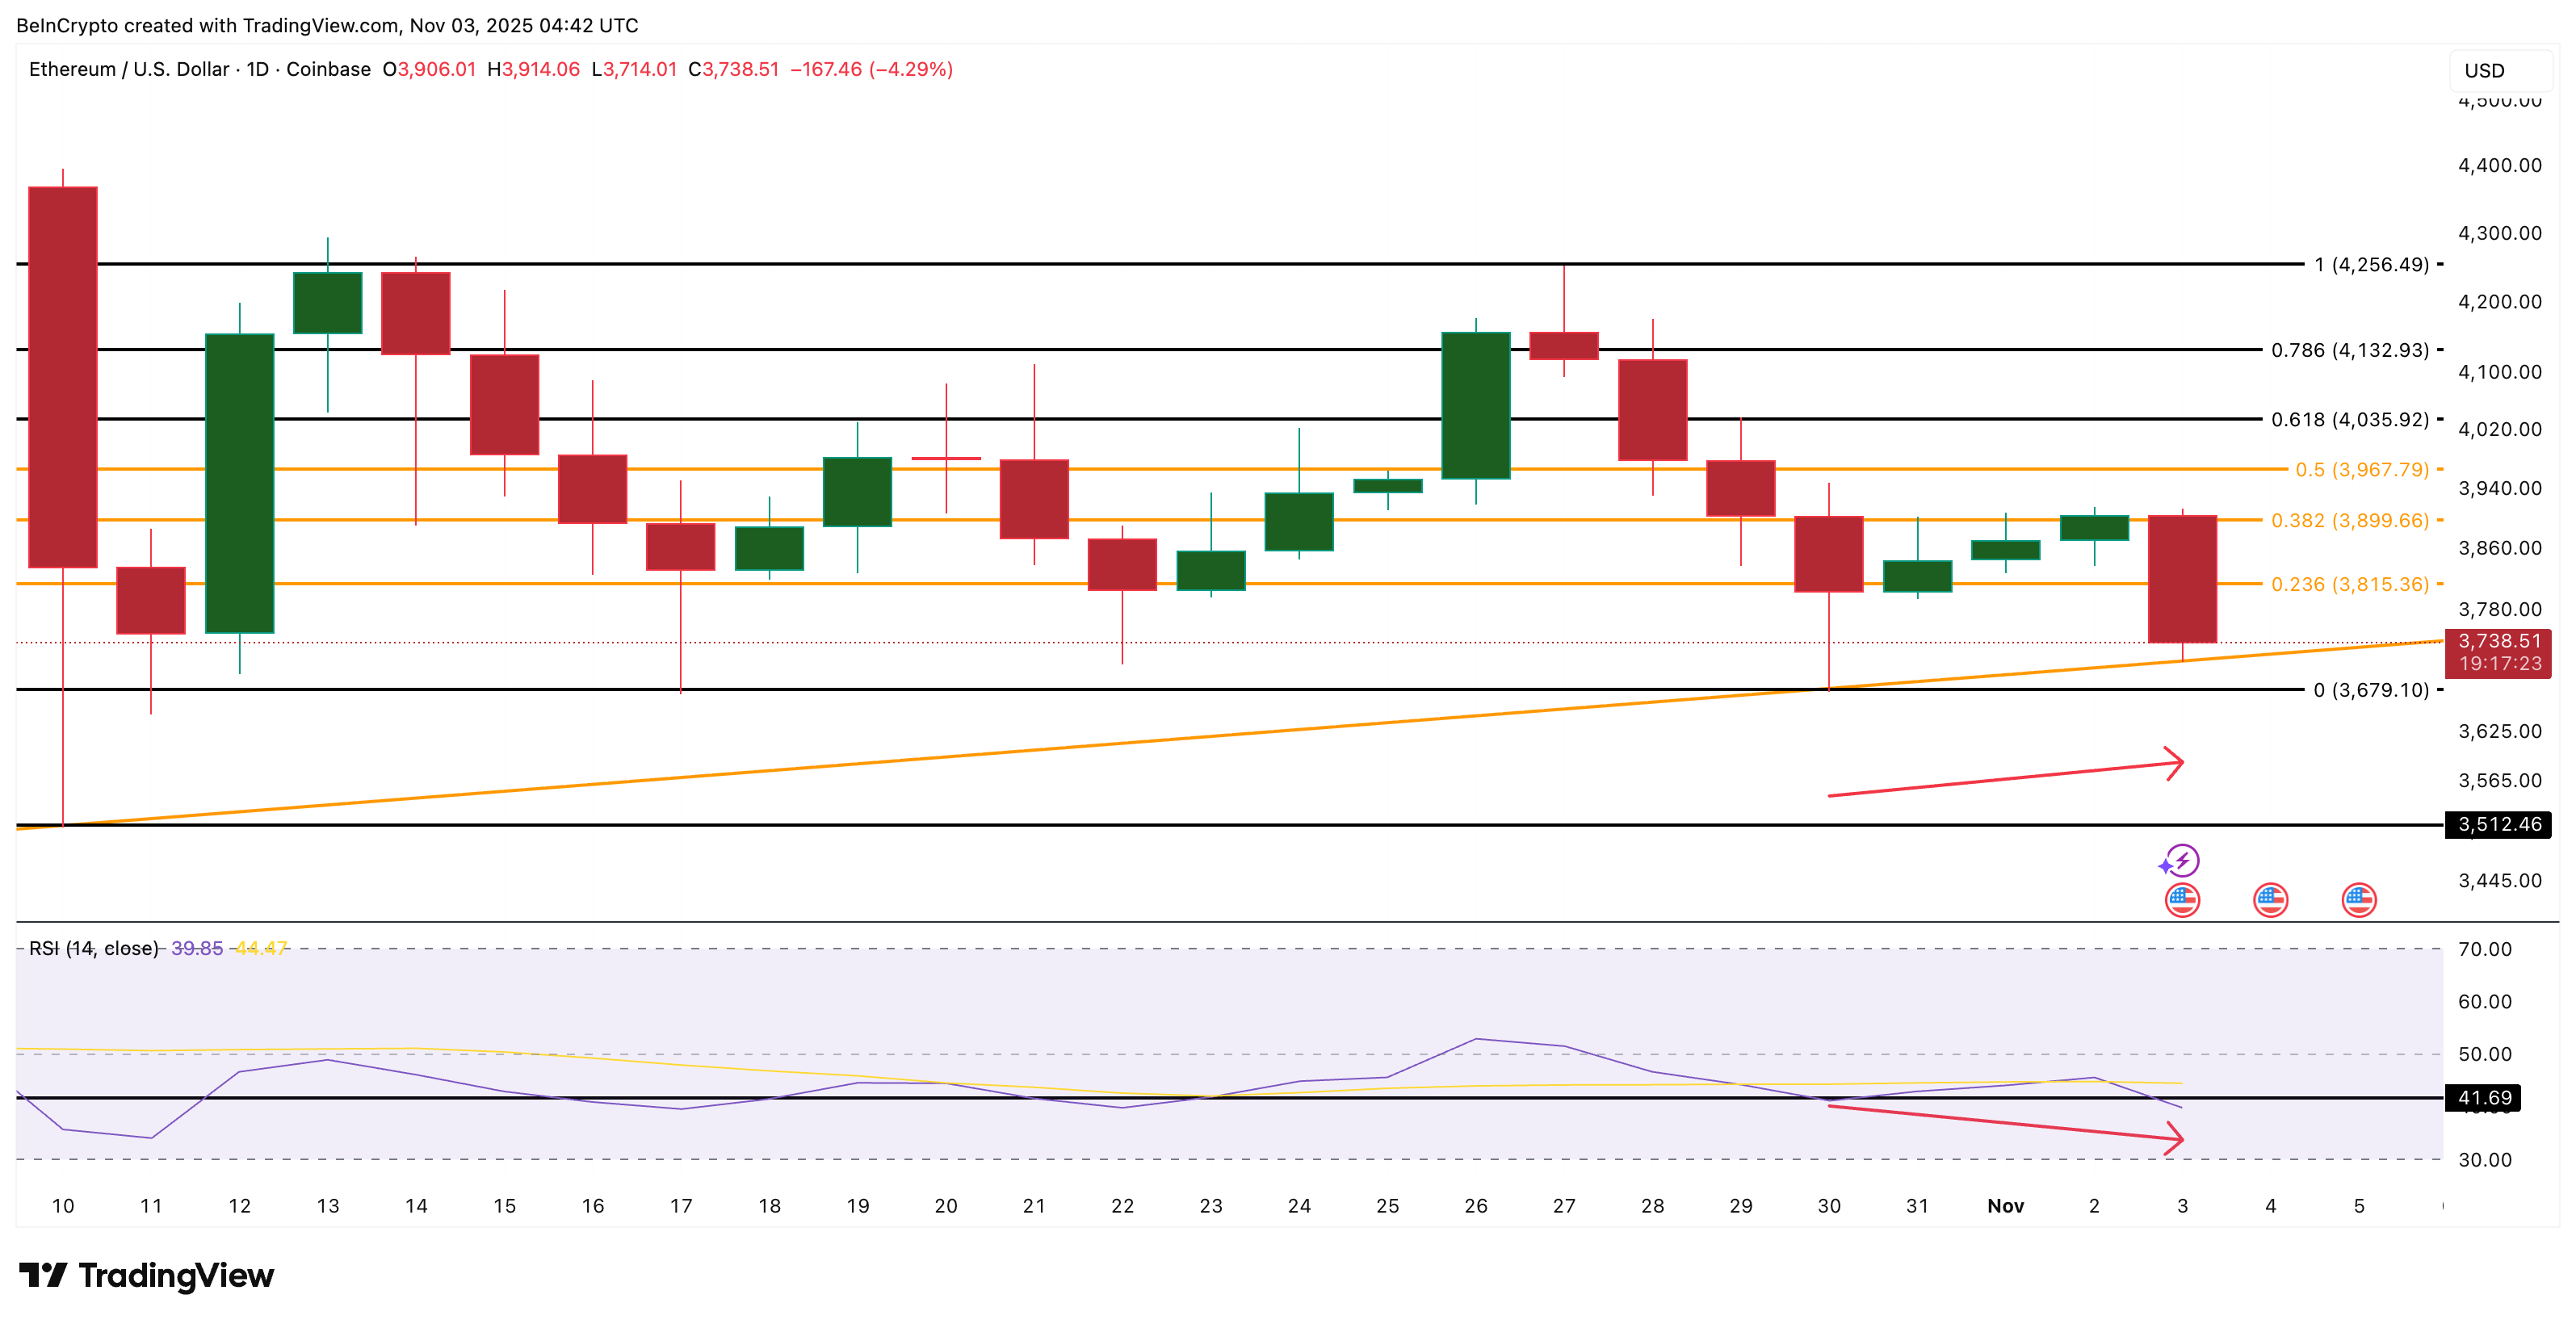
On the daily chart, Ethereum trades within an ascending triangle, where prices keep making higher lows along an upward-sloping support line. This structure usually reflects buyer resilience even during pullbacks. The Fibonacci levels mark key resistance and support zones within this triangle.
Between October 30 and November 3, the ETH price formed a higher low, while the Relative Strength Index (RSI) — which measures the balance between buying and selling strength on a scale of 0 to 100 — made a lower low. This pattern is a hidden bullish divergence, suggesting that the underlying momentum remains positive despite the price dip.
 Ethereum Price Analysis:
TradingView
Ethereum Price Analysis:
TradingView
If the Ethereum price manages to hold above the $3,679 support zone, a rebound toward $3,899 (0.382 Fibonacci) could begin. Further strength above $4,035 and $4,132 would confirm the recovery and invalidate the short-term bearish bias. Do note that this key support zone has earlier been validated by the cost basis heatmap.
A daily price close below $3,679, however, would break the ascending trendline and open the path to a deeper correction. That could even push the ETH prices to $3,512, invalidating the rebound outlook.
Disclaimer: The content of this article solely reflects the author's opinion and does not represent the platform in any capacity. This article is not intended to serve as a reference for making investment decisions.
You may also like
Goldman Sachs predicts that the "U.S. government shutdown" will end within two weeks, making a Federal Reserve rate cut in December "more justified"?
Goldman Sachs predicts that the government shutdown is "most likely to end around the second week of November," but also warns that key economic data will be delayed.
I traded perpetual contracts for a month: from dreaming of getting rich overnight to a sobering reality.
Find a group of people who are doing the same thing as you, preferably those who are smarter than you.

Solana Consolidates Above $177 Support as Market Watches $200 Breakout Level

BTC Dominance Faces 60% Barrier Before Next Halving Cycle