HBAR Price Walks a Tightrope Between Sellers and Buyers — Can Whales Tip the Balance?

HBAR price is caught between long-term pressure and rising interest, trading within a narrow $0.16–$0.20 range. Short-term momentum hints at recovery, but long-term signals warn of weakness. Whales are quietly adding, and if money flow stays positive, they could be the ones to finally tip the balance.
The HBAR price has been moving within a narrow range, indicating that buyers and sellers are still competing for control. Over the past month, it has declined by about 21%, with a 11% weekly loss. Yet compared to Bitcoin and Ethereum, HBAR’s losses have slowed.
The chart now captures a tug-of-war between long-term weakness and early buying signs. Momentum is improving, but long-term signals still flash caution. Whether the balance holds or breaks could depend on how whales act next.
Buyers Push Back As Sellers Hold The Line
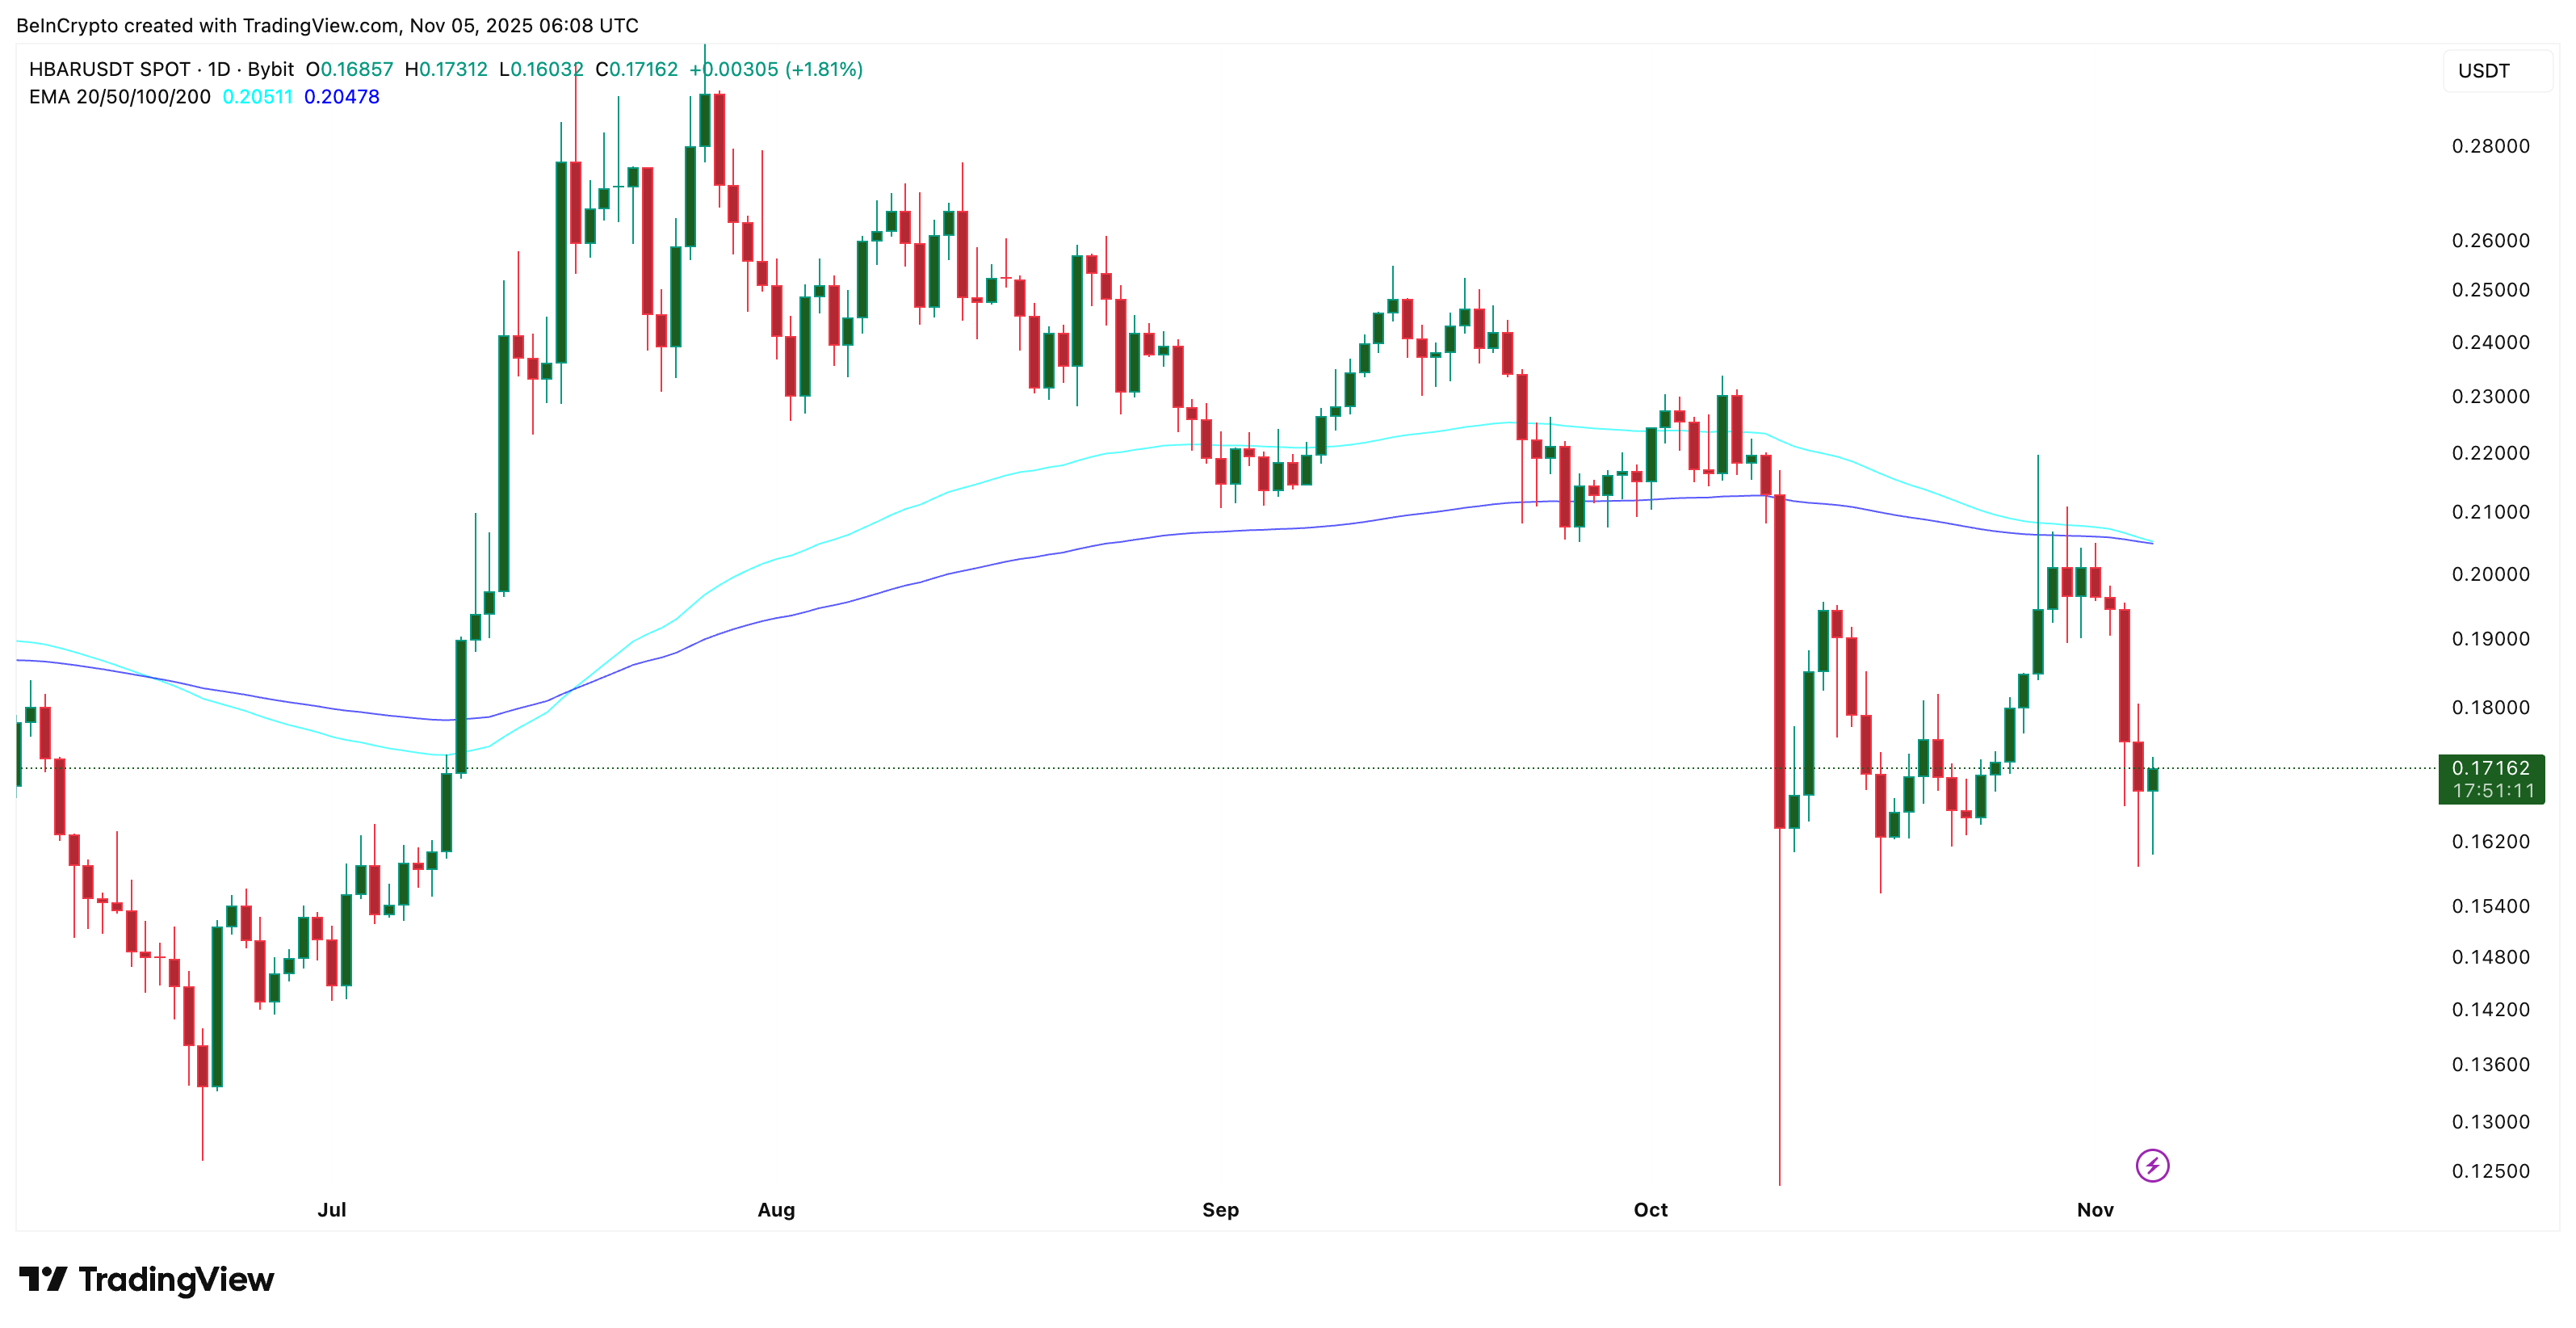
On the daily chart, HBAR shows two signals moving in opposite directions. A bearish crossover is forming between the 100-day and 200-day Exponential Moving Averages (EMAs). EMAs smooth out price data to show long-term trend direction.
When a shorter EMA drops below a longer one, it signals that momentum is weakening and long-term sellers are still exerting pressure on the price. And that sets up a correction-like move.
 Bearish Crossover Forms For HBAR:
TradingView
Bearish Crossover Forms For HBAR:
TradingView
Want more token insights like this? Sign up for Editor Harsh Notariya’s Daily Crypto Newsletter.
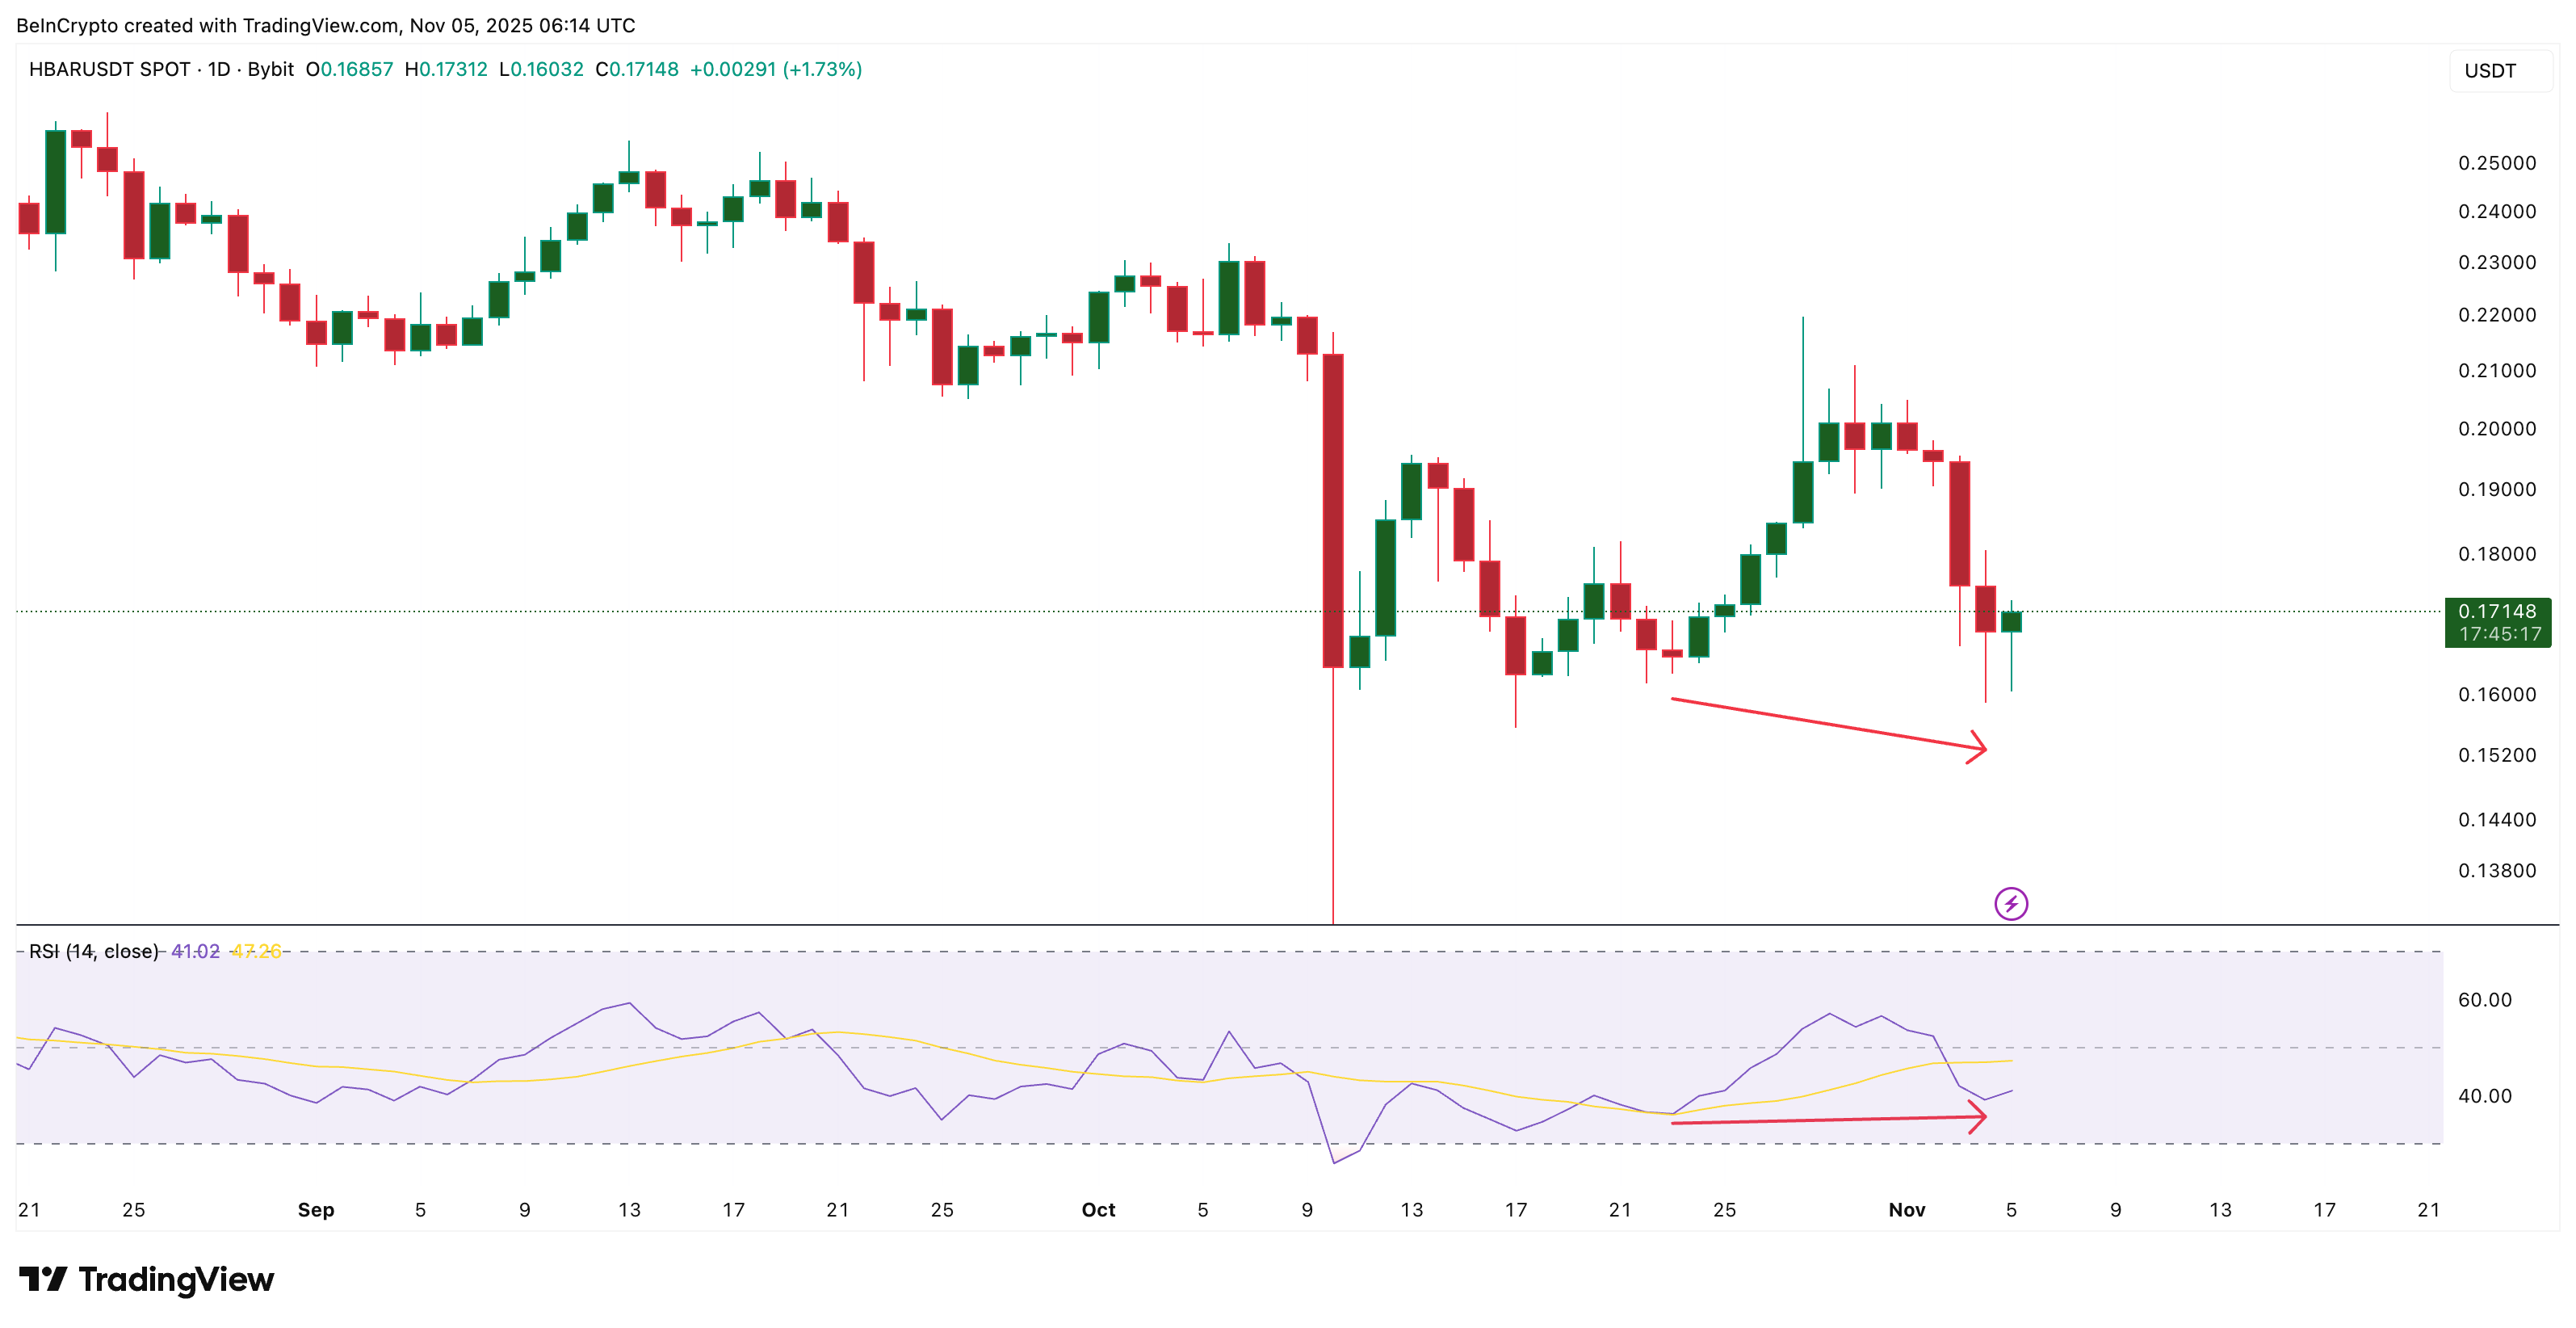
But not all indicators agree. Between October 23 and November 4, the price made a lower low, while the Relative Strength Index (RSI) — which measures whether an asset is overbought or oversold — formed a higher low.
This setup is called a bullish divergence. It usually means that selling pressure is slowing and buyers are starting to return with some hope.
 Bullish Divergence In Play:
TradingView
Bullish Divergence In Play:
TradingView
That split defines HBAR’s current phase. Momentum hints at recovery, but the overall trend remains under pressure. This push-and-pull could keep the HBAR price locked in a range that has held since October 11.
The range shows balance — short-term buyers testing strength while long-term sellers still defend resistance.
Whales Add Positions As Money Flow Strengthens, Aiming To Lift HBAR Price
While the technical picture looks divided, on-chain data shows that large investors may already be taking the buyer’s side.
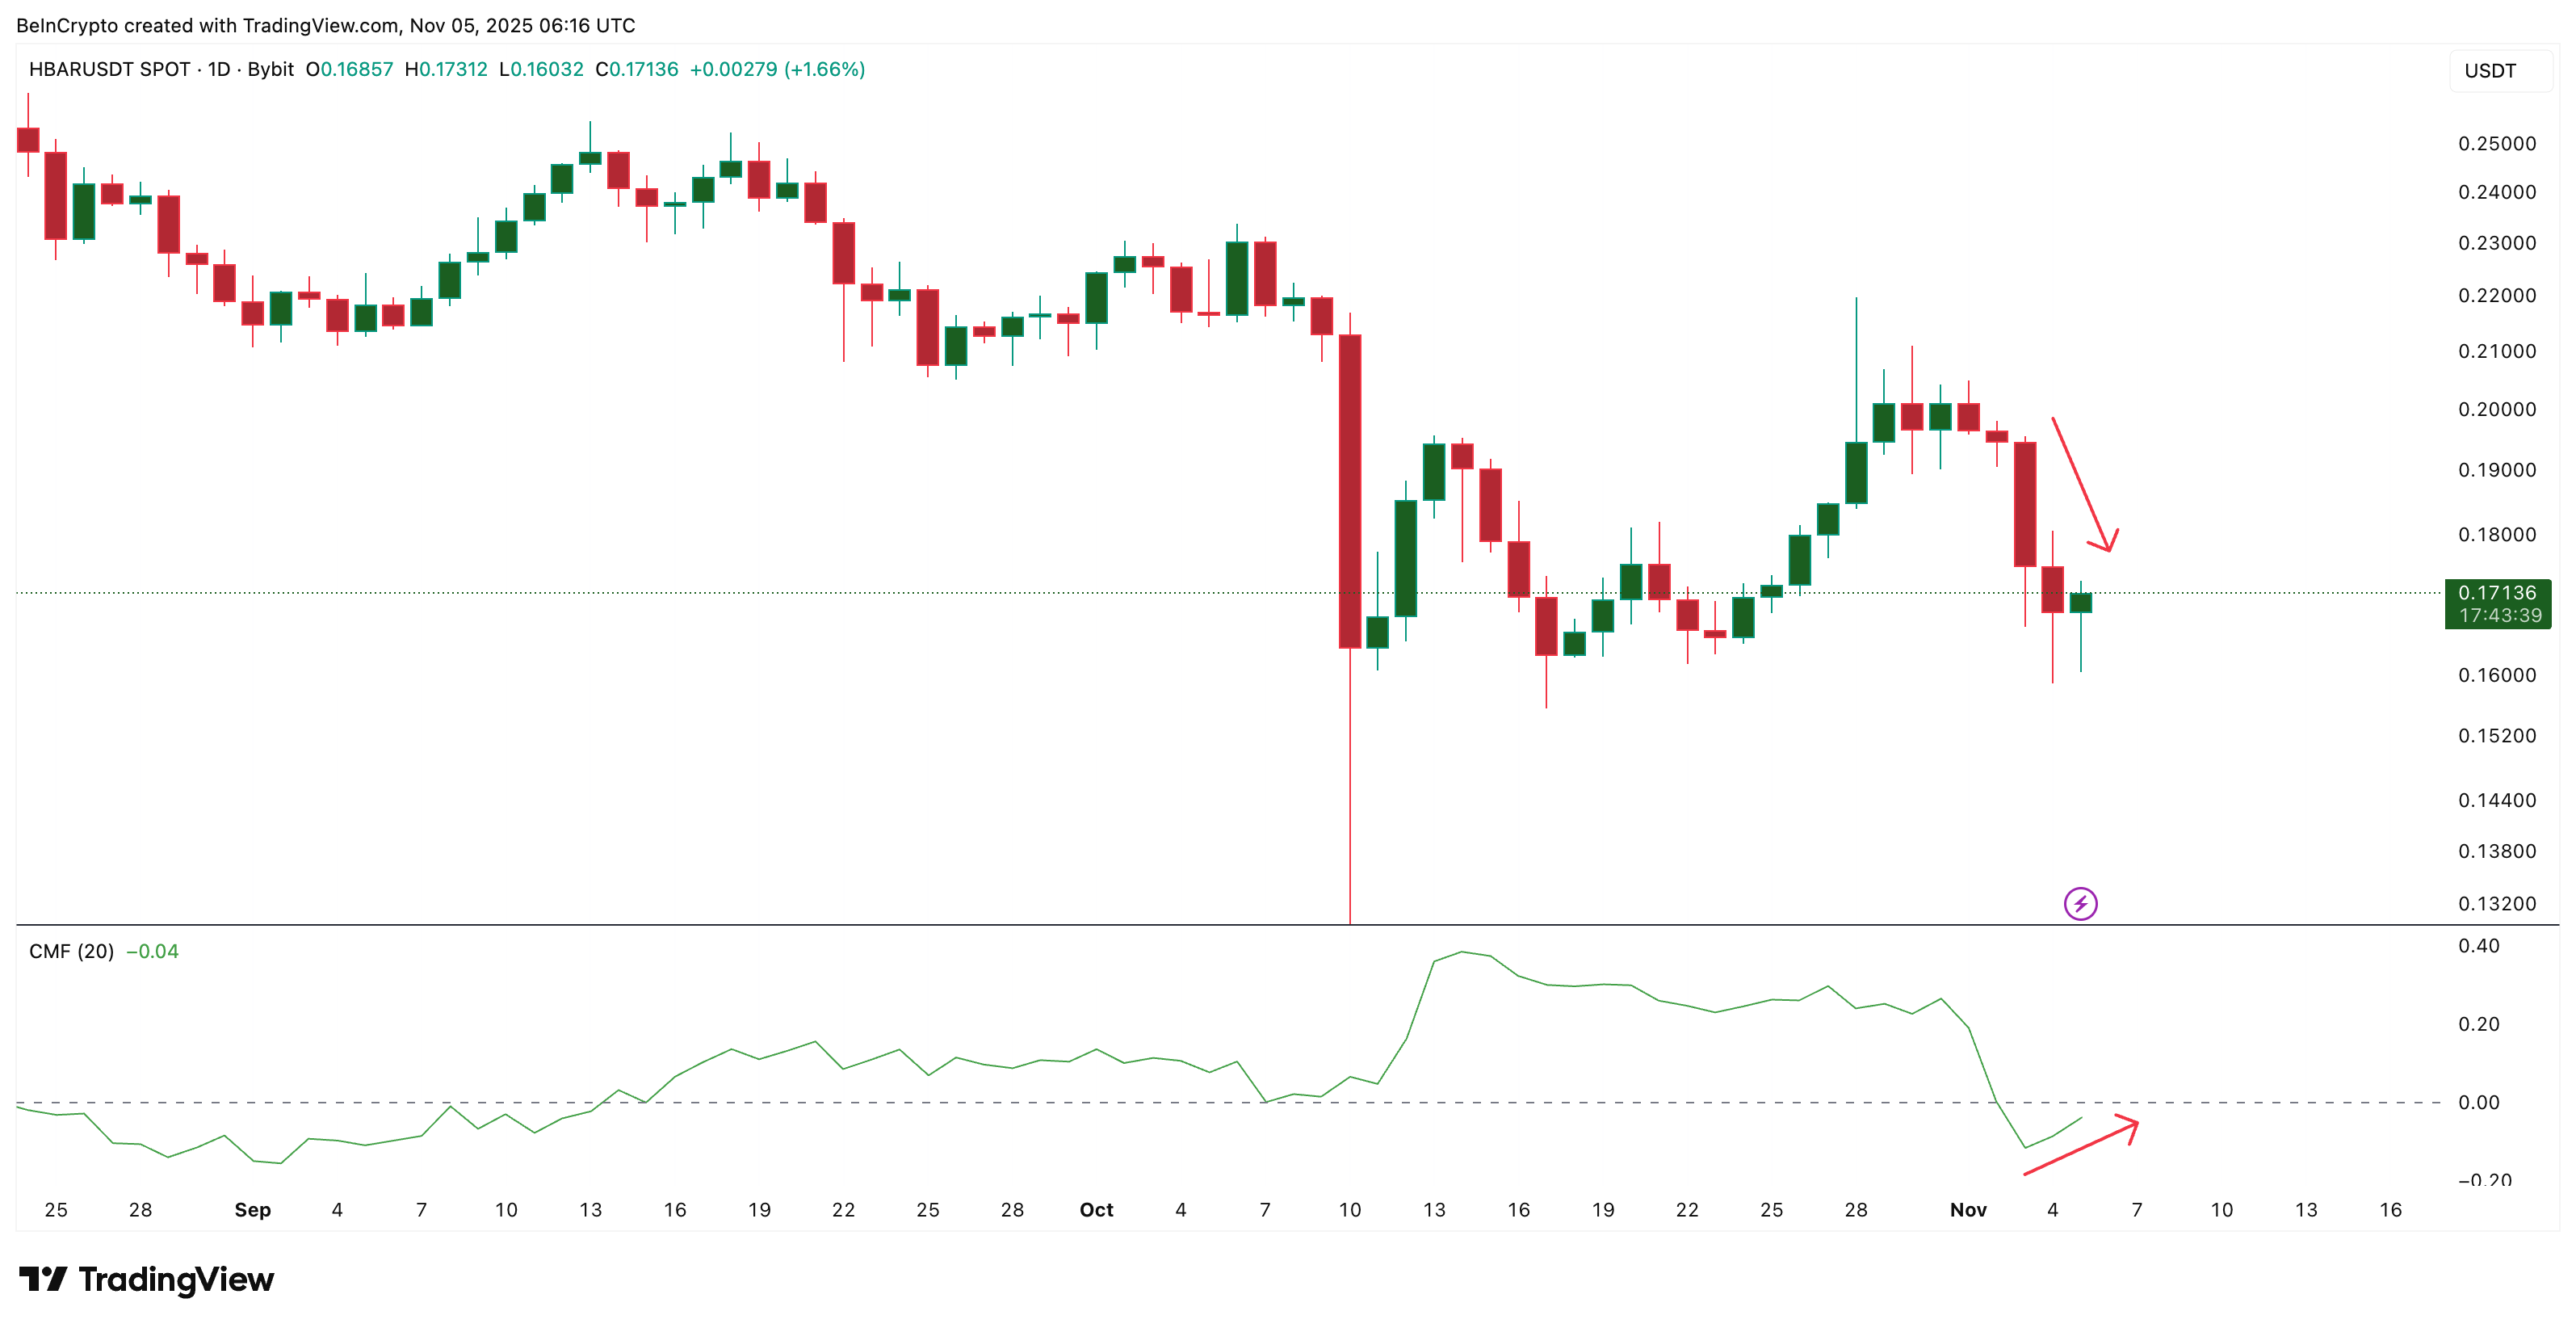
The Chaikin Money Flow (CMF) — which measures money moving in and out of the asset — has been rising since November 3, even as the HBAR price dipped. When CMF rises while the price falls, it indicates that significant capital is entering, often driven by whales and long-term holders.
 Big Money Enters HBAR:
TradingView
Big Money Enters HBAR:
TradingView
This divergence between price and money flow shows that whales are quietly buying the dip while the market debates direction. Between November 3 and 5, as prices fell toward $0.16, CMF strengthened — signaling that inflows are building against short-term selling.
If CMF continues above 0, it would confirm steady accumulation and could help HBAR push toward the upper end of its range near $0.20. But if whales eventually slow down, the lower level of the range could get exposed.
As for the range that has been holding since October 11, $0.16-$0.20 is the one to focus on.
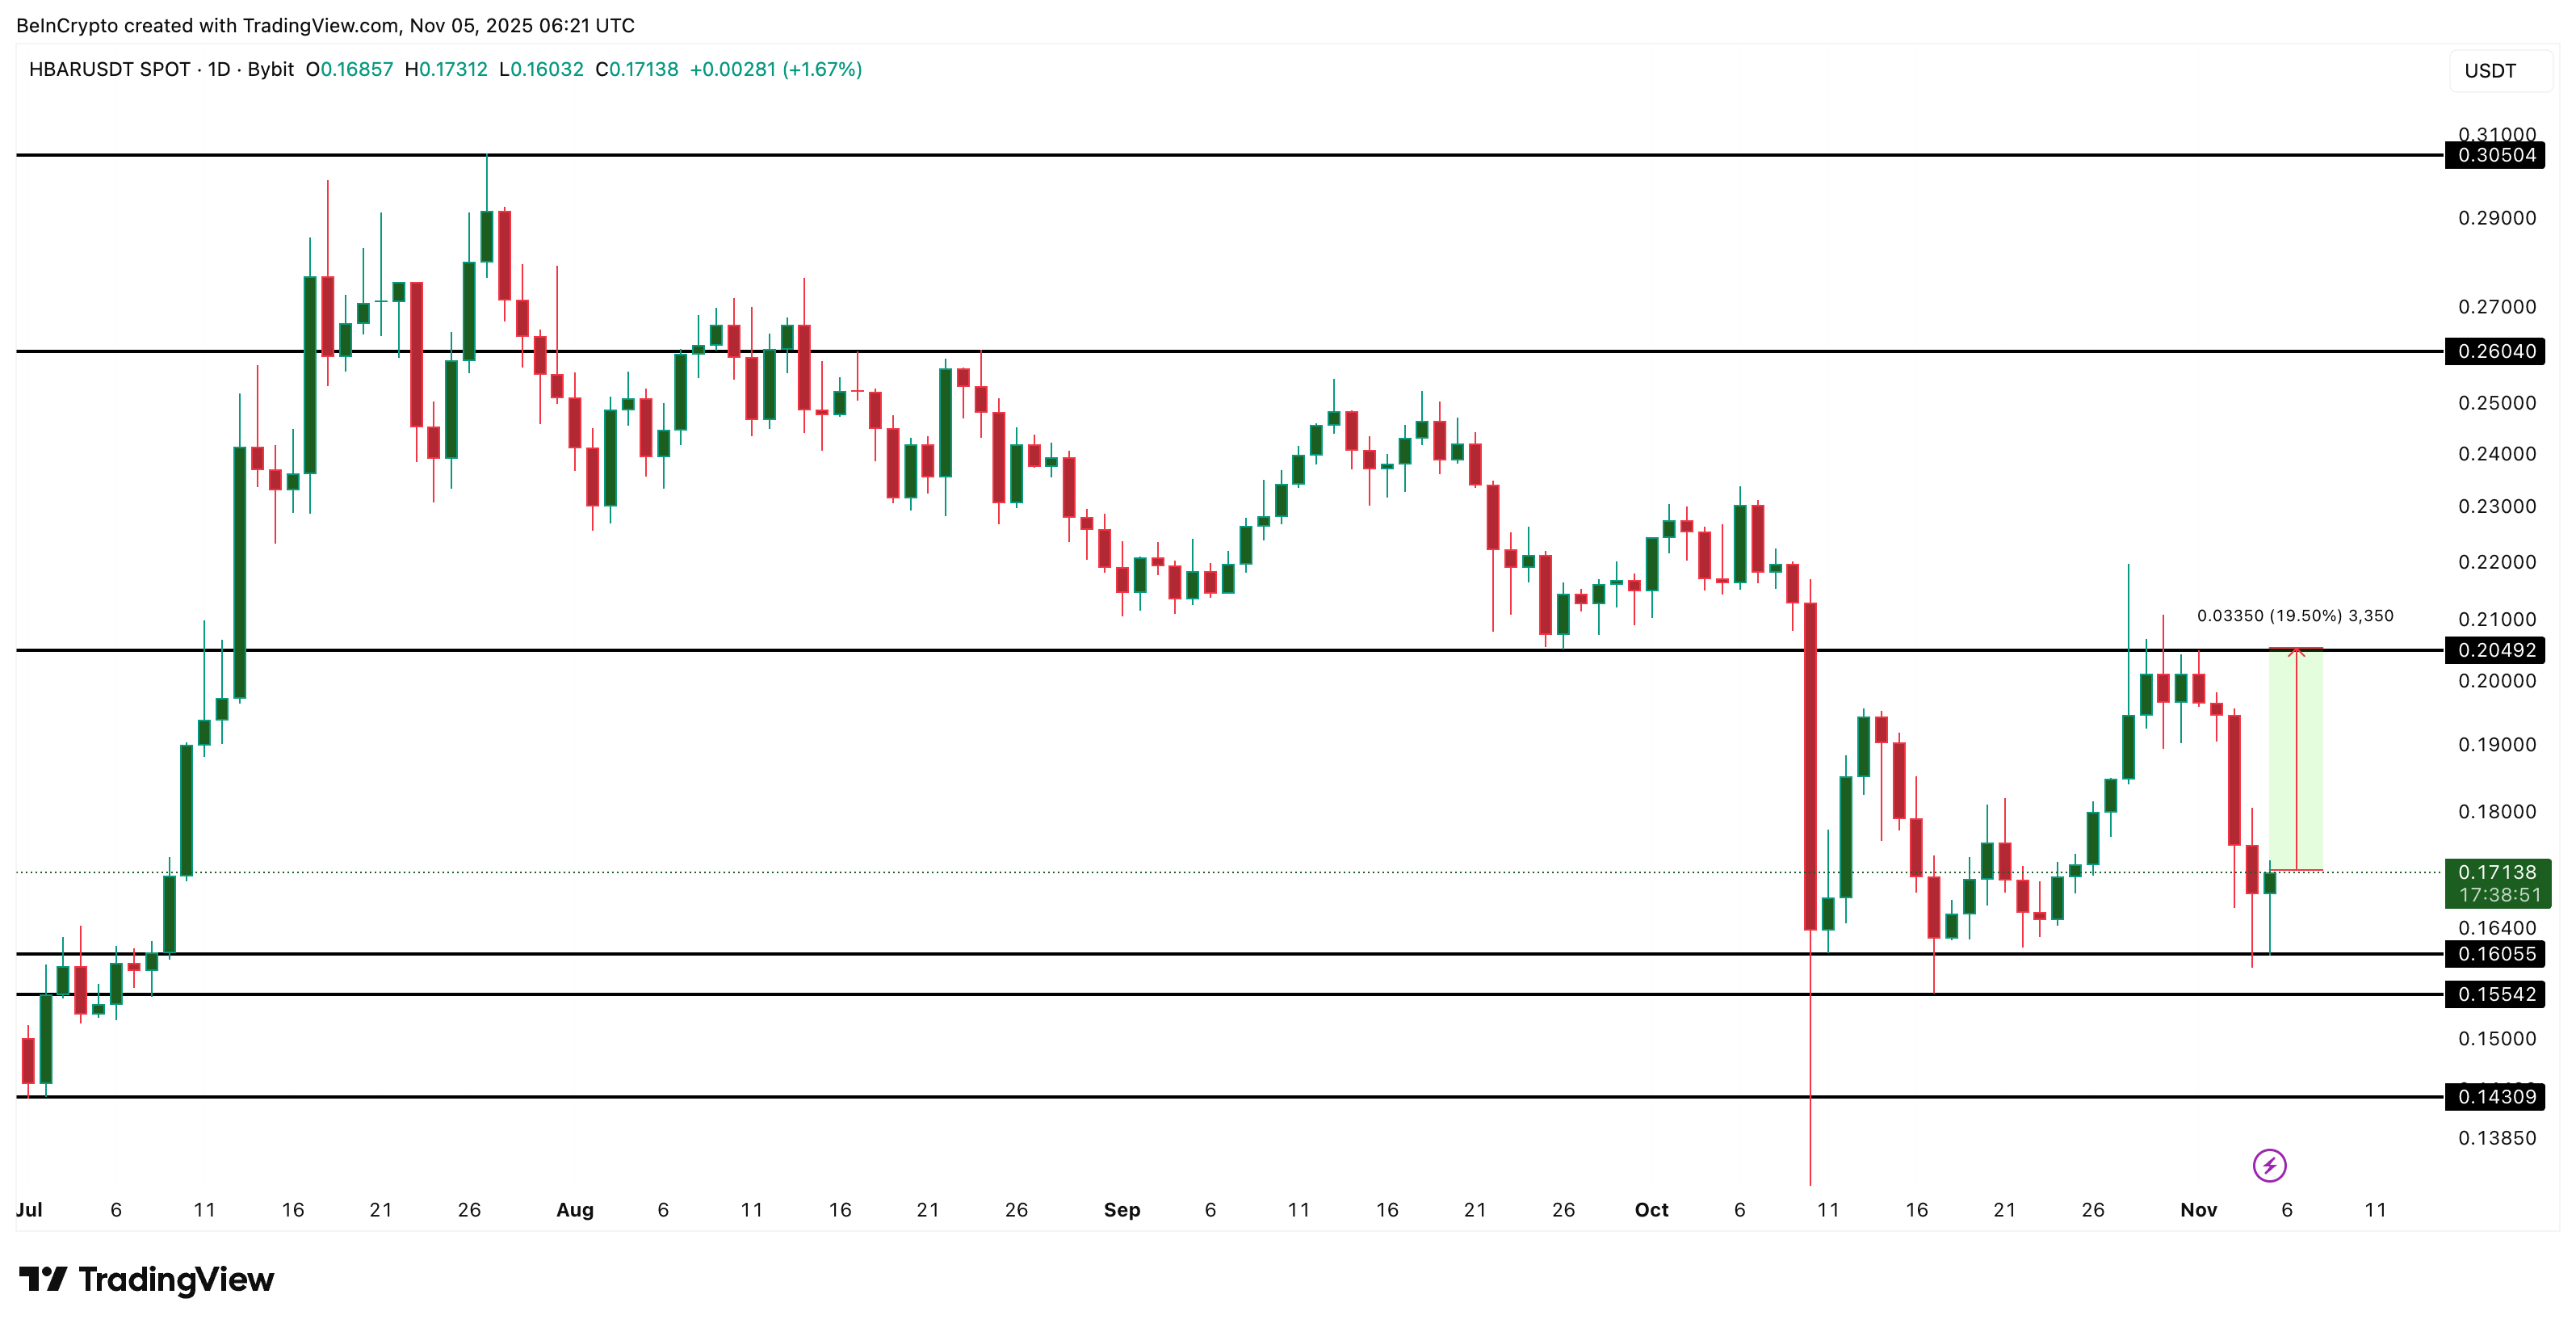 HBAR Price Analysis:
TradingView
HBAR Price Analysis:
TradingView
A breakout and daily close above $0.20 would be the first sign of real bullish momentum. However, if the price breaks below $0.16, it could expose $0.14, another critical support level.
Disclaimer: The content of this article solely reflects the author's opinion and does not represent the platform in any capacity. This article is not intended to serve as a reference for making investment decisions.
You may also like
Microsoft Strikes $9.7B Deal With IREN as AI Demand Surges
XRP ETF: Nate Geraci predicts a launch within two weeks
Sequans Sells 970 Bitcoins, Unsettling the Markets
Crypto: Kaiko ranks XRP above Solana and Dogecoin in 2025