
Data shows that the bear market bottom will form in the $55,000–$70,000 range.

The next bitcoin bear market may see a milder decline compared to previous cycles. If the price falls back to the $55,000–$70,000 range, it would be a normal cyclical movement rather than a sign of systemic collapse.
The next bitcoin bear market may see a milder decline compared to previous cycles. If the price falls back to the $55,000–$70,000 range, it will be a normal cyclical movement rather than a signal of systemic collapse.
Written by: Matt Crosby
Translated by: AididiaoJP, Foresight News
Although the current market is more focused on how high bitcoin can rise in this bull run, it is equally important to prepare for upcoming market changes. This article uses historical cycles, on-chain valuation indicators, and bitcoin fundamentals to estimate the next bear market bottom through data and mathematical models. This is not a specific prediction, but rather the establishment of an analytical framework.
Cycle Model: Analyzing Historical Price Bottom Patterns
The "Bitcoin Cycle Model" is currently one of the most reliable tools for identifying market bottoms. It integrates multiple on-chain indicators to construct a price valuation range.
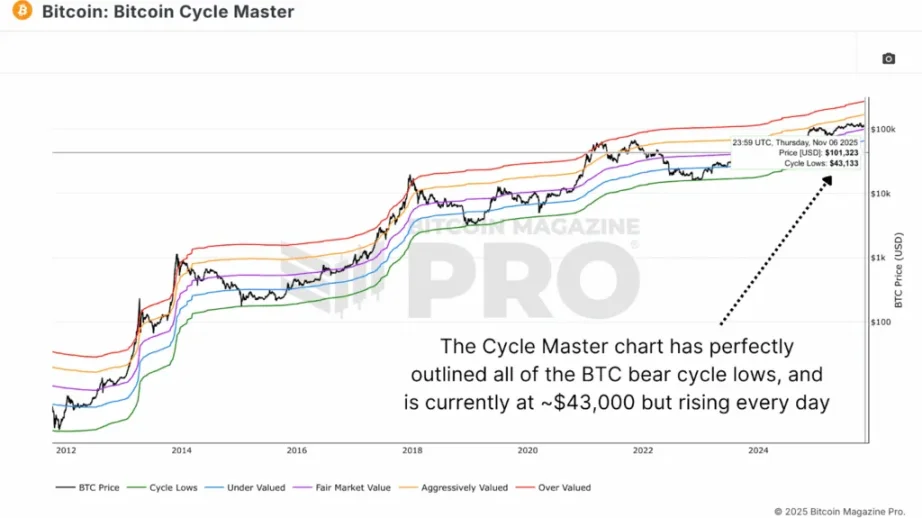
Figure 1: The model's "cycle low" indicator has accurately captured the bottom of each bear market
This green "cycle low" line has historically marked macro bottoms with precision: $160 in 2015, $3,200 in 2018, and $15,500 at the end of 2022. Currently, this indicator is at $43,000 and continues to rise, providing a reference benchmark for estimating the next cycle bottom.
Diminishing Pattern: Why Bear Market Pullbacks Are Weakening
Through the MVRV ratio (market value to realized value), it can be observed that when the market enters a deep bear phase, bitcoin's price typically falls to 0.75 times the realized price, which is 25% below the average holding cost across the network.
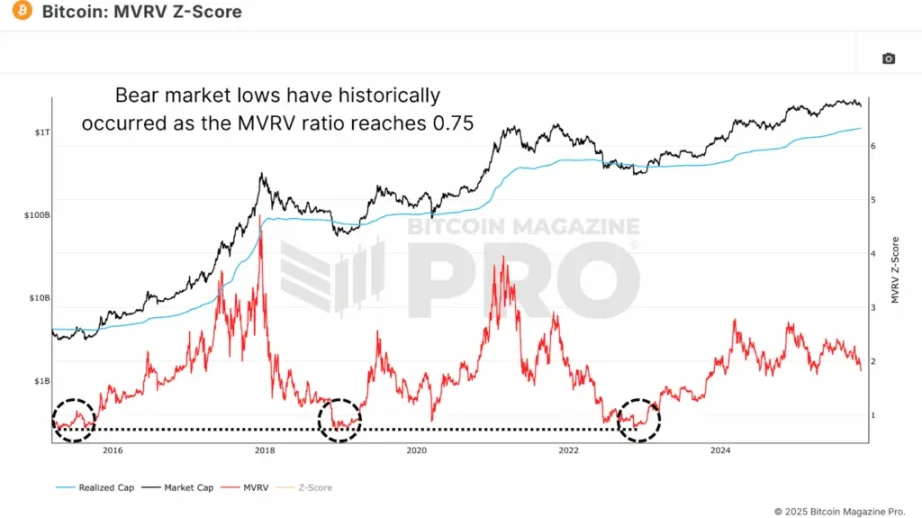
Figure 2: Each bear market bottom has occurred when the MVRV ratio dropped to 0.75
Combining this with the trend of diminishing pullbacks: the maximum decline in early cycles reached 88%, compressed to 80% in 2018, and further reduced to 75% in 2022. Following this trend, the maximum pullback in the next bear market may be limited to around 70%.
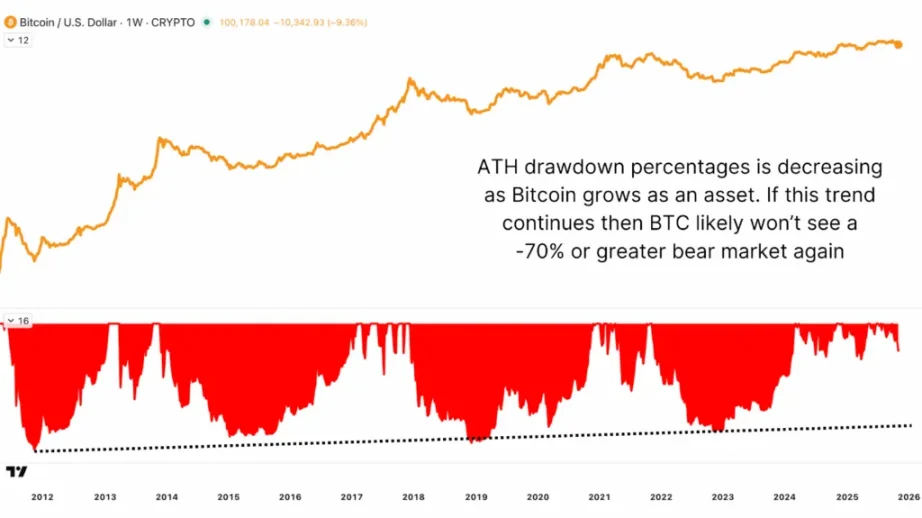
Figure 3: The trend of diminishing bear market declines suggests the next pullback will not exceed 70%
Predicting the Next Bull-Bear Turning Point
Before estimating the bottom, it is necessary to first determine the peak of this bull market. Historical data shows that bitcoin's top usually appears around 2.5 times the realized price. If this pattern continues, a high of $180,000 may be reached by the end of 2025.
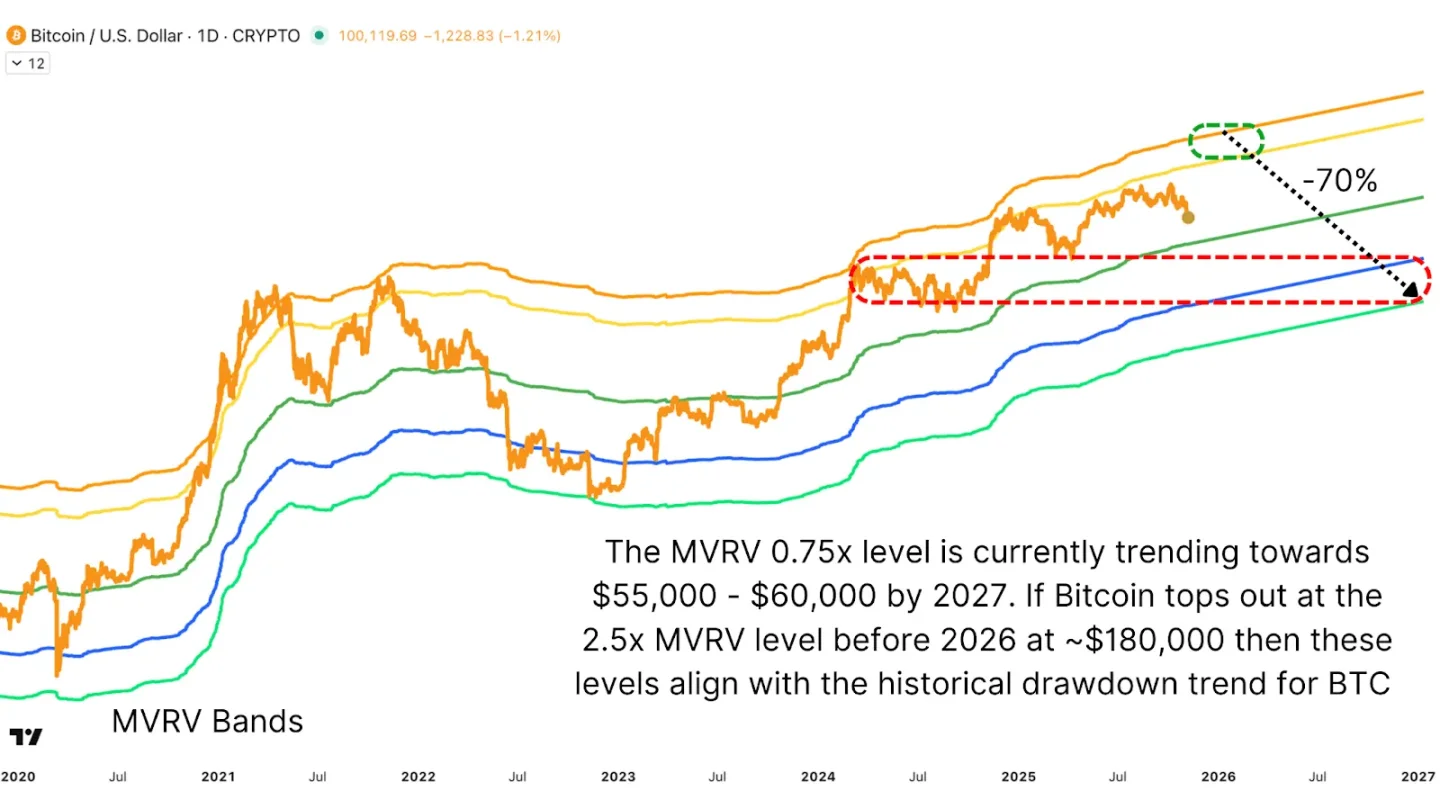
Figure 4: The comprehensive model predicts a cycle top of $180,000, with the 2027 bear market bottom range at $55,000–$60,000
If bitcoin continues the pattern of "bottoming one year after peaking," and retreats 70% from the peak in 2027, the bottom range will fall between $55,000 and $60,000. This range coincides technically with last year's consolidation platform.
The Support Role of Production Cost in Price
Bitcoin's production cost (the electricity cost of mining one coin) is an important anchor for long-term value and has always closely matched bear market bottoms. After each halving, the cost doubles, forming a continuously rising price floor.
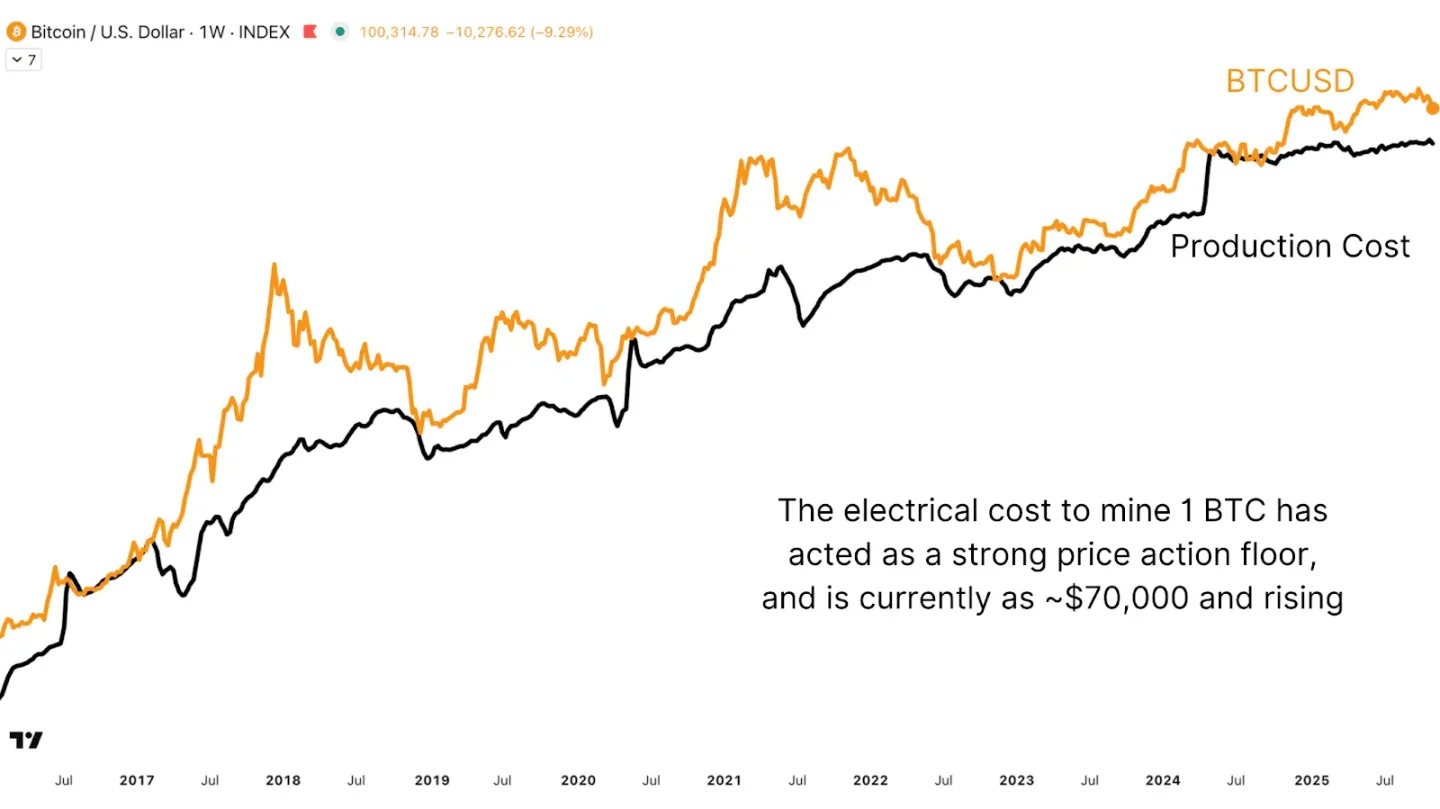
Figure 5: The current production cost of about $70,000 per coin provides strong price support
When the coin price falls below production cost, it often triggers miner production cuts and creates historic buying opportunities. After the April 2024 halving, the cost line has risen significantly, and each recent approach to this level has triggered a strong rebound. The current value anchor is about $70,000.
Conclusion: The New Cycle Will Be Milder
In every cycle, there are always claims that "this time is different," but data consistently reveals underlying patterns. Although institutional participation and financialization have changed the market structure, they have not eliminated cyclical characteristics.
All signs indicate that the next bear market will be milder, reflecting a maturing market and deepening liquidity. If the price falls back to the $55,000–$70,000 range, it will be a normal cyclical movement rather than a signal of systemic collapse.
Disclaimer: The content of this article solely reflects the author's opinion and does not represent the platform in any capacity. This article is not intended to serve as a reference for making investment decisions.
You may also like
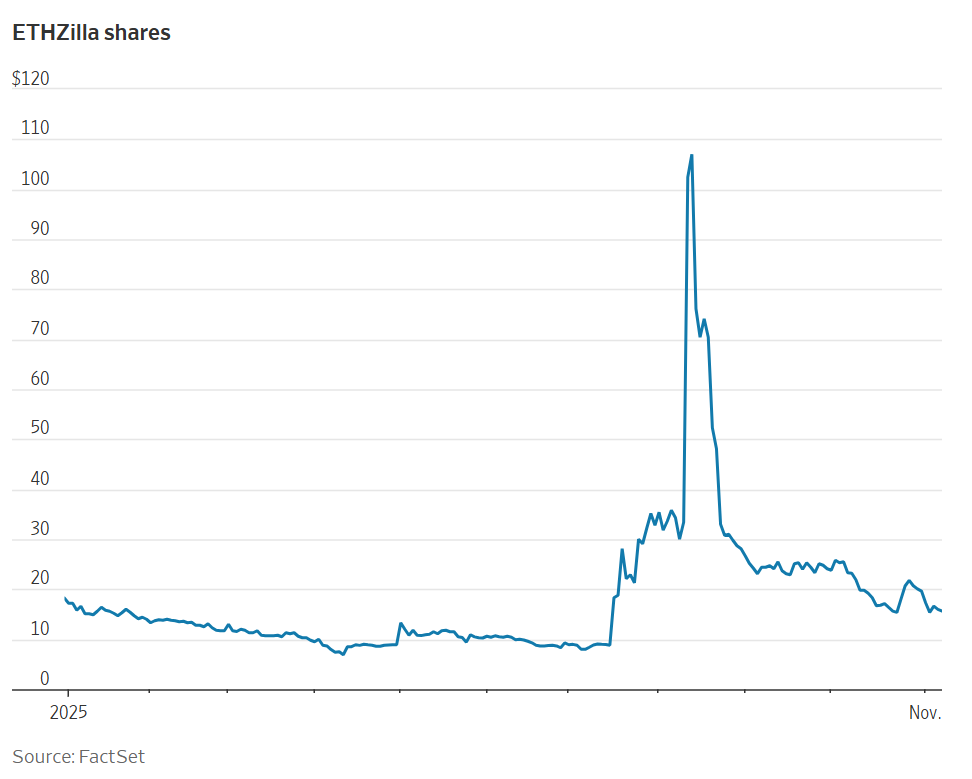
This year's hottest cryptocurrency trade suddenly collapses—should investors cut their losses or buy the dip?
The cryptocurrency boom has cooled rapidly, and the leveraged nature of treasury stocks has amplified losses, causing the market value of the giant whale Strategy to nearly halve. Well-known short sellers have closed out their positions and exited, while some investors are buying the dip.
Showcasing portfolios, following top influencers, one-click copy trading: When investment communities become the new financial infrastructure
The platforms building this layer of infrastructure are creating a permanent market architecture tailored to the way retail investors operate.
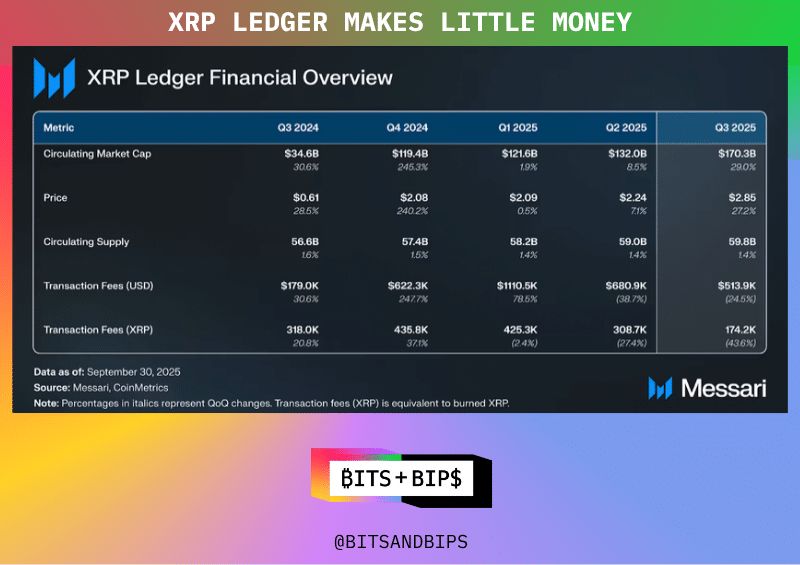
Ripple raised another $500 million—are investors buying $XRP at a discount?
The company raised funds at a valuation of $40 billions, but it already holds $80 billions worth of $XRP.
CoinShares: Net outflow of $1.17 billion from digital asset investment products last week.