Date: Wed, Nov 12, 2025 | 10:48 AM GMT
The cryptocurrency market is showing signs of a rebound in the last few hours as Ethereum (ETH) climbed from its 24-hour low of $3,404 to around $3,533. This short-term recovery has lifted market sentiment, pushing several altcoins into the green — including Jasmycoin (JASMY), which is beginning to flash a promising bullish setup on the charts.
While JASMY’s gains remain modest for now, its technical structure is forming what appears to be a “Power of 3” pattern, a setup widely recognized for signaling early smart money accumulation and potential breakout moves.
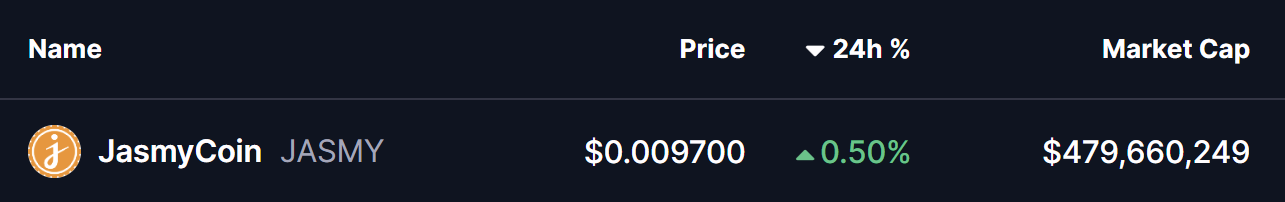 Source: Coinmarketcap
Power of 3 in Play?
Looking at the 2-hour chart, JASMY seems to be developing a textbook “Power of 3” structure — a three-phase pattern that includes Accumulation, Manipulation, and Expansion.
Accumulation Phase
Earlier, JASMY moved within a tight sideways range between $0.01017 and $0.00973. This period of low volatility — shown as a grey box on the chart — highlights the accumulation phase, where institutional or long-term traders often build positions before a potential breakout.
Manipulation Phase
On November 11, JASMY briefly broke down below the accumulation zone, dropping to a local low of $0.0092 before quickly bouncing back. This move likely marked the manipulation phase, designed to flush out weak hands by triggering stop-losses and creating a false breakdown — a classic sign of liquidity collection before the next leg higher.
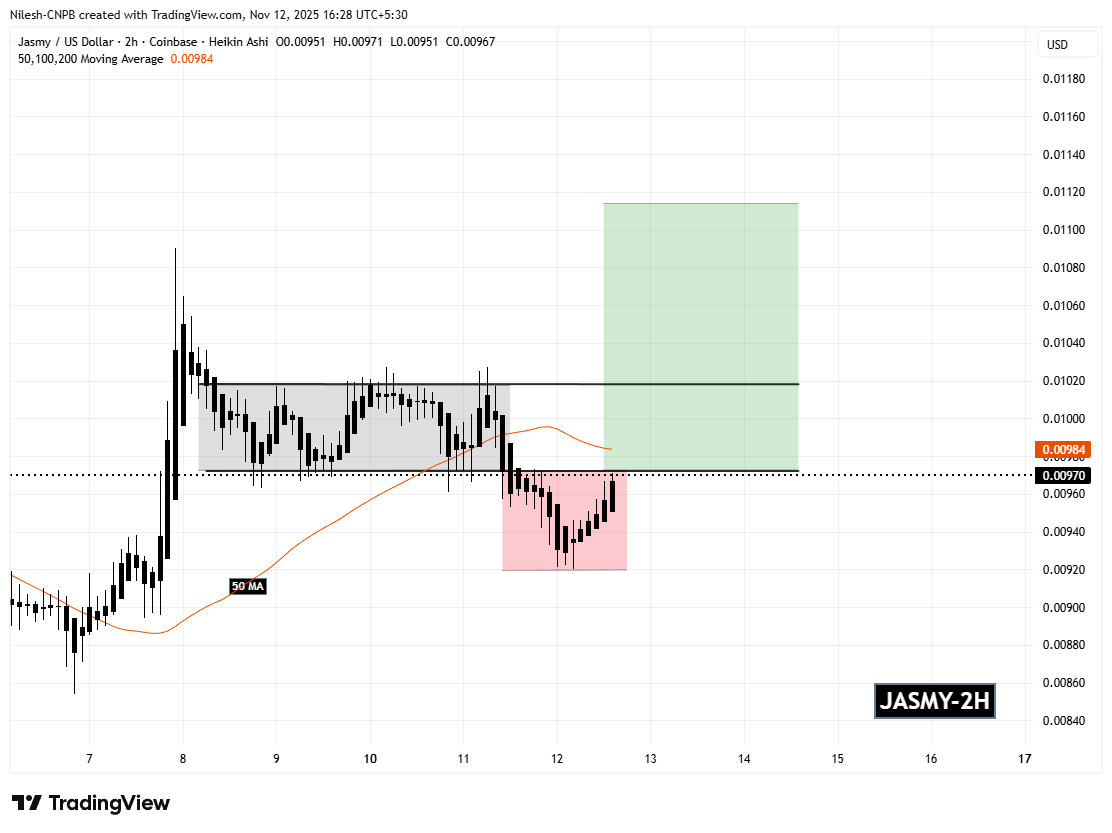 Jasmycoin (JASMY) 2H Chart/Coinsprobe (Source: Tradingview)
What’s Next for JASMY?
At the time of writing, JASMY is trading just below its former range’s lower boundary, around $0.0097, while sitting under the 50-period moving average (MA) at $0.00984, which now acts as a short-term resistance level.
If JASMY reclaims both the $0.00973 level and the 50 MA, it would strongly suggest that the manipulation phase has concluded and that the expansion phase — the final and most powerful stage of the “Power of 3” — is likely beginning.
From there, the next resistance to watch is near $0.01065, and if bulls manage to break and hold above that level, the measured move target of the pattern sits around $0.01114 — representing an estimated 14% upside from the current price.
However, traders should watch the $0.0092 support closely. A decisive drop below that level could invalidate the bullish setup, potentially signaling a delay before another accumulation cycle forms.