According to CoinMarketCap data , the cryptocurrency trades at $0.1621, down more than 20% in the past 30 days and 7% in the last 24 hours. The trading volume of the token shot up 48% as the nearest resistance stands at the 20-day EMA at $0.17.
The weekly chart reveals that Dogecoin has slipped out of its long-standing ascending channel and is now retesting the upper boundary of a major demand zone between $0.12 and $0.17. Historically, DOGE prices have rebounded from this level, even during broader market downturns.
DOGE Price Analysis: What’s Next?
As per the weekly chart below, the RSI shows a hidden bullish divergence, with the indicator printing lower lows while price forms higher lows, an early sign that bearish momentum may be decelerating.
This divergence often marks the tail end of correction cycles rather than the beginning of deeper pullbacks.
If the price succeeds in holding the $0.17 zone, a rebound toward the $0.22 area becomes increasingly likely.
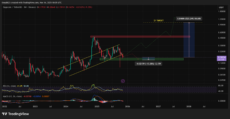
Source: TradingView
A sustained breakdown below $0.17 could expose the price to deeper tests of the $0.15 and $0.12, which form the final layers of strong support visible on the chart.
On the other hand, holding this area could allow DOGE to begin building the structure required for a larger macro rally towards the $1 mark.