Date: Fri, Nov 21, 2025 | 06:40 PM GMT
Bitcoin’s sharp downturn continues to shake the market as the flagship cryptocurrency plunged to a low of $80,600, before recovering slightly to around $84,000 at the time of writing. This drop extends what has now become a deep and painful correction from its October peak of $126,080, wiping out all gains accumulated throughout 2025 and amplifying volatility across the entire crypto landscape.
 Source: Coinmarketcap
Today’s steep decline triggered nearly $1.87 billion in liquidations across the market. Long traders suffered the overwhelming majority of the damage, losing $1.63 billion as overleveraged positions were liquidated in a rapid, cascading sell-off.
Bitcoin’s Social Sentiment Is Falling
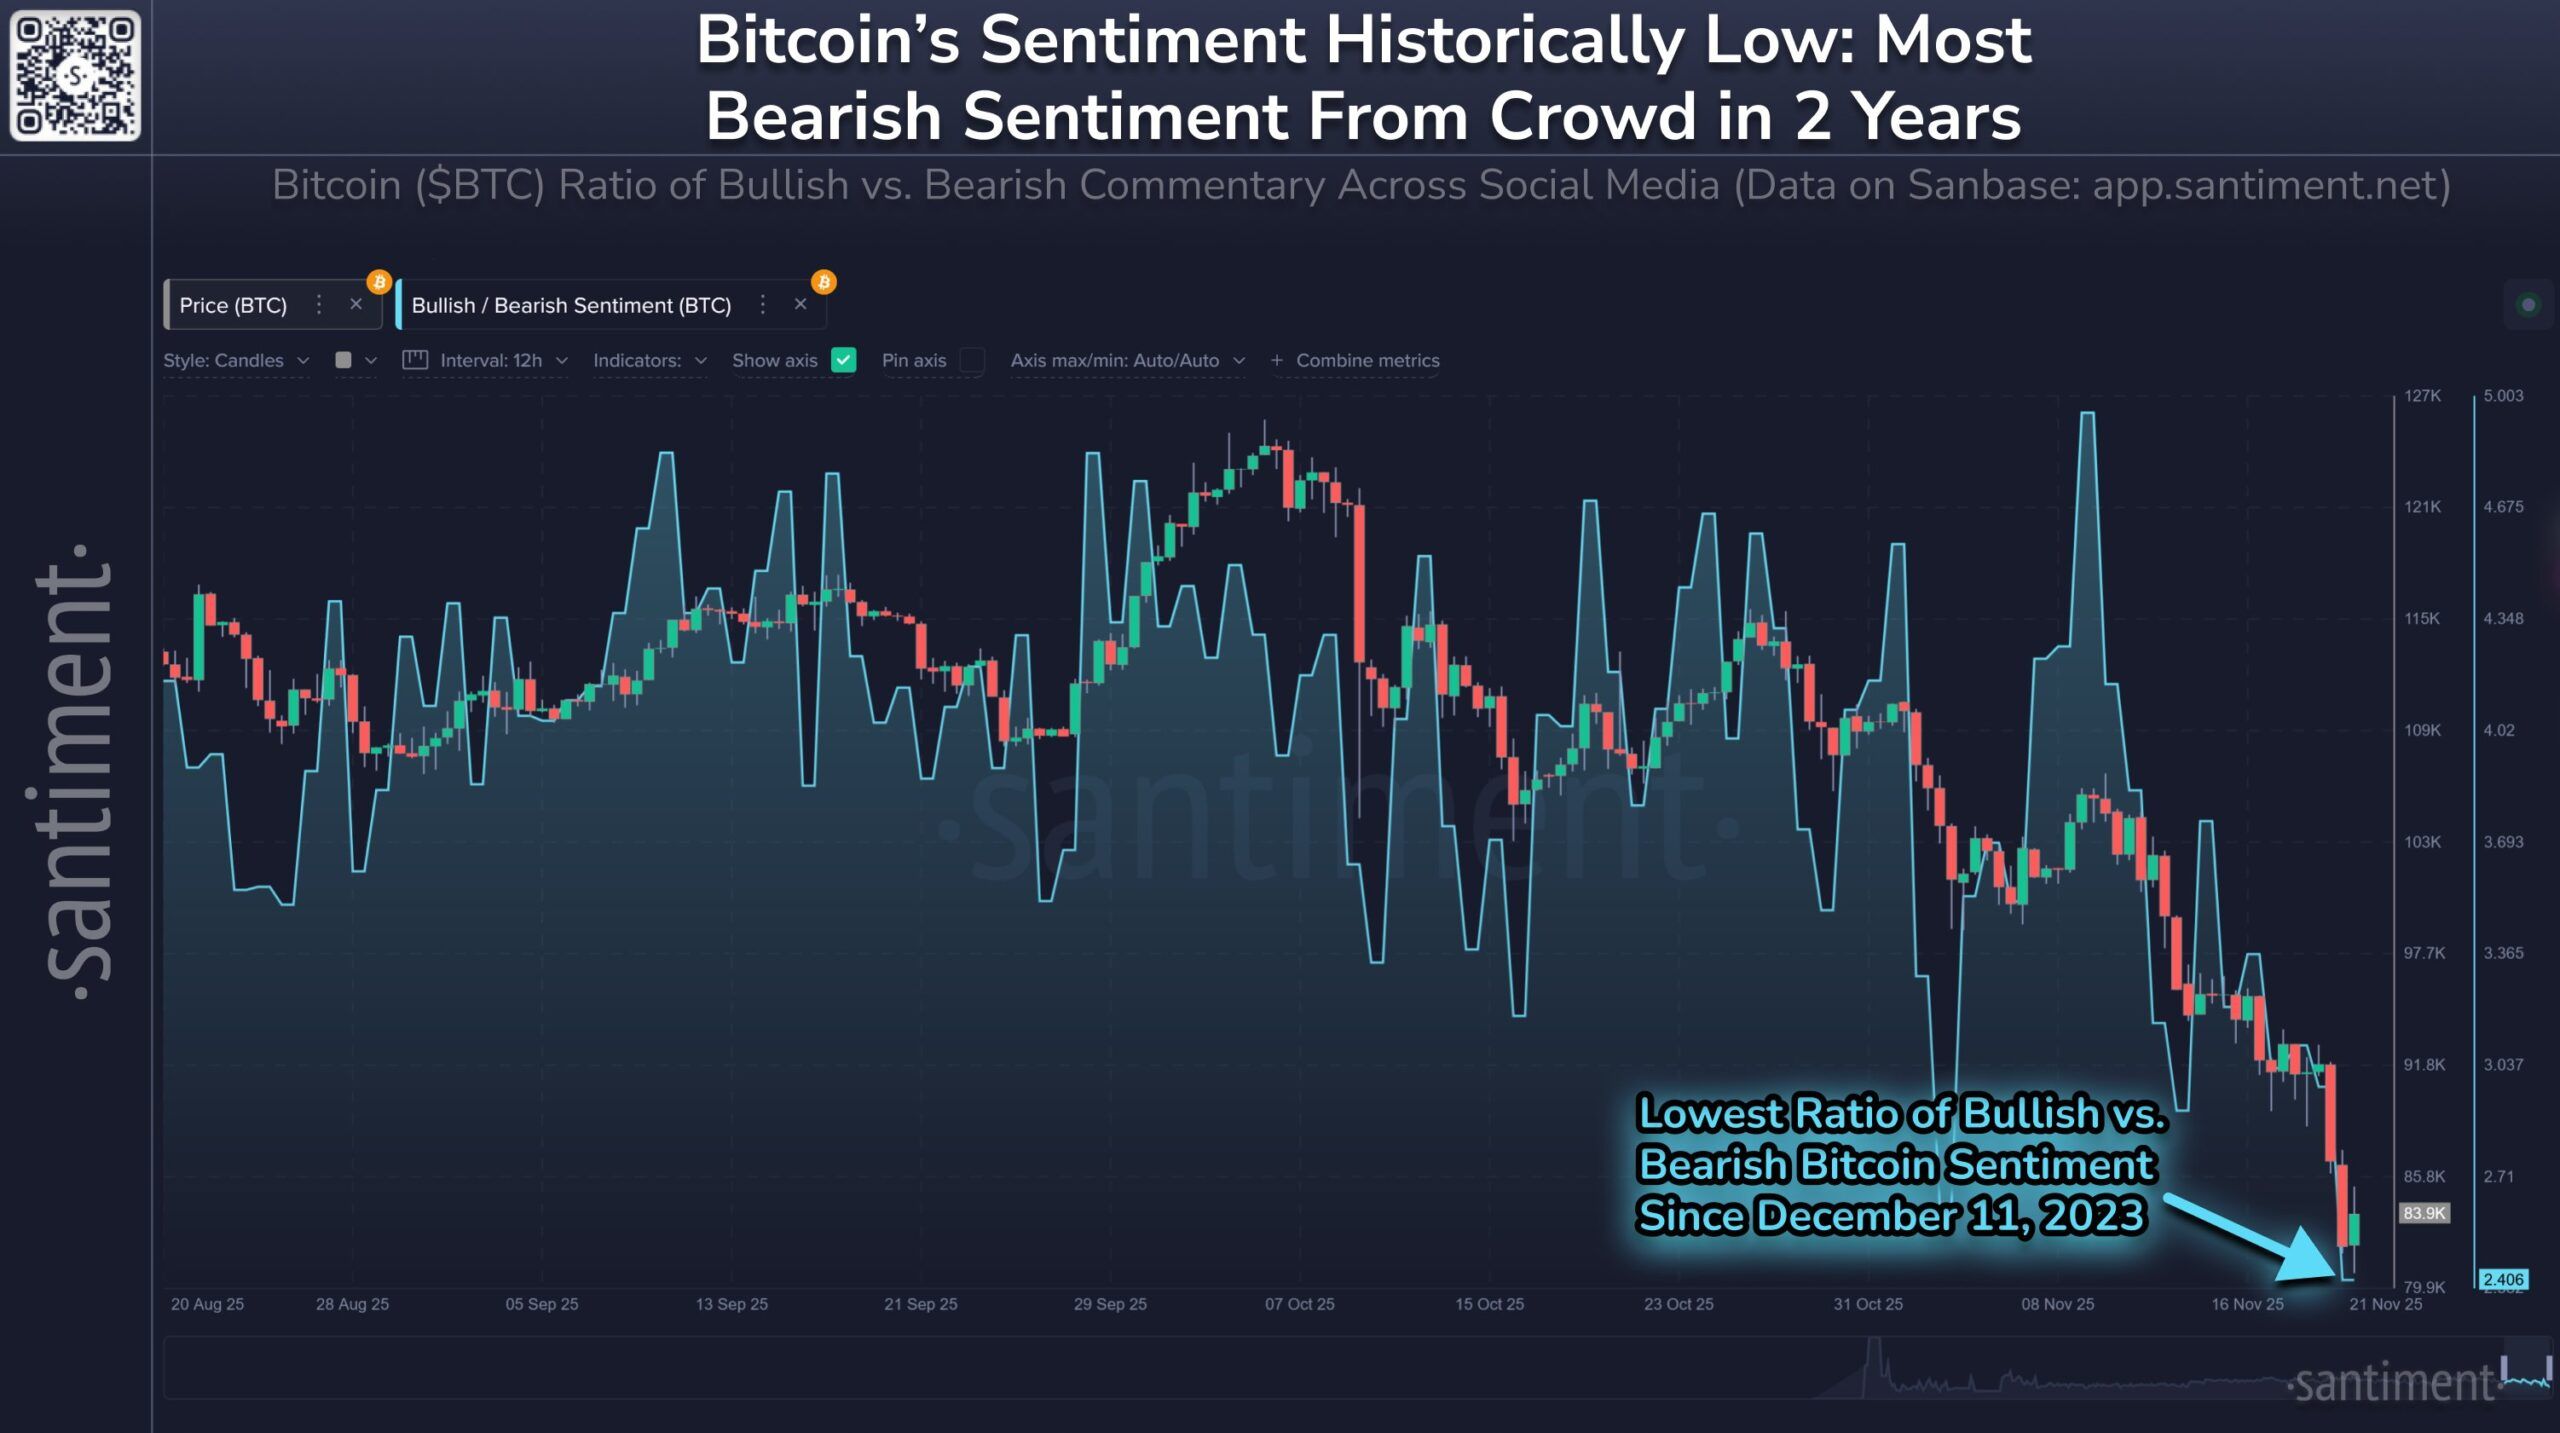
According to new insights from Santiment , Bitcoin’s social sentiment has dropped to its lowest reading since December 11, 2023. Based on the ratio of bullish vs. bearish comments across X, Reddit, Telegram, and other platforms, retail traders appear to be capitulating aggressively. Panic is now dominating the conversation—something not seen in nearly two years.
 Source: @santimentfeed (X)
Historically, deep negative sentiment often aligns with market bottoms, as fear peaks right before a trend reversal. This raises an important question: could this emotional climate actually set the stage for Bitcoin’s next rebound?
Could This Pattern Spark a BTC Rebound?
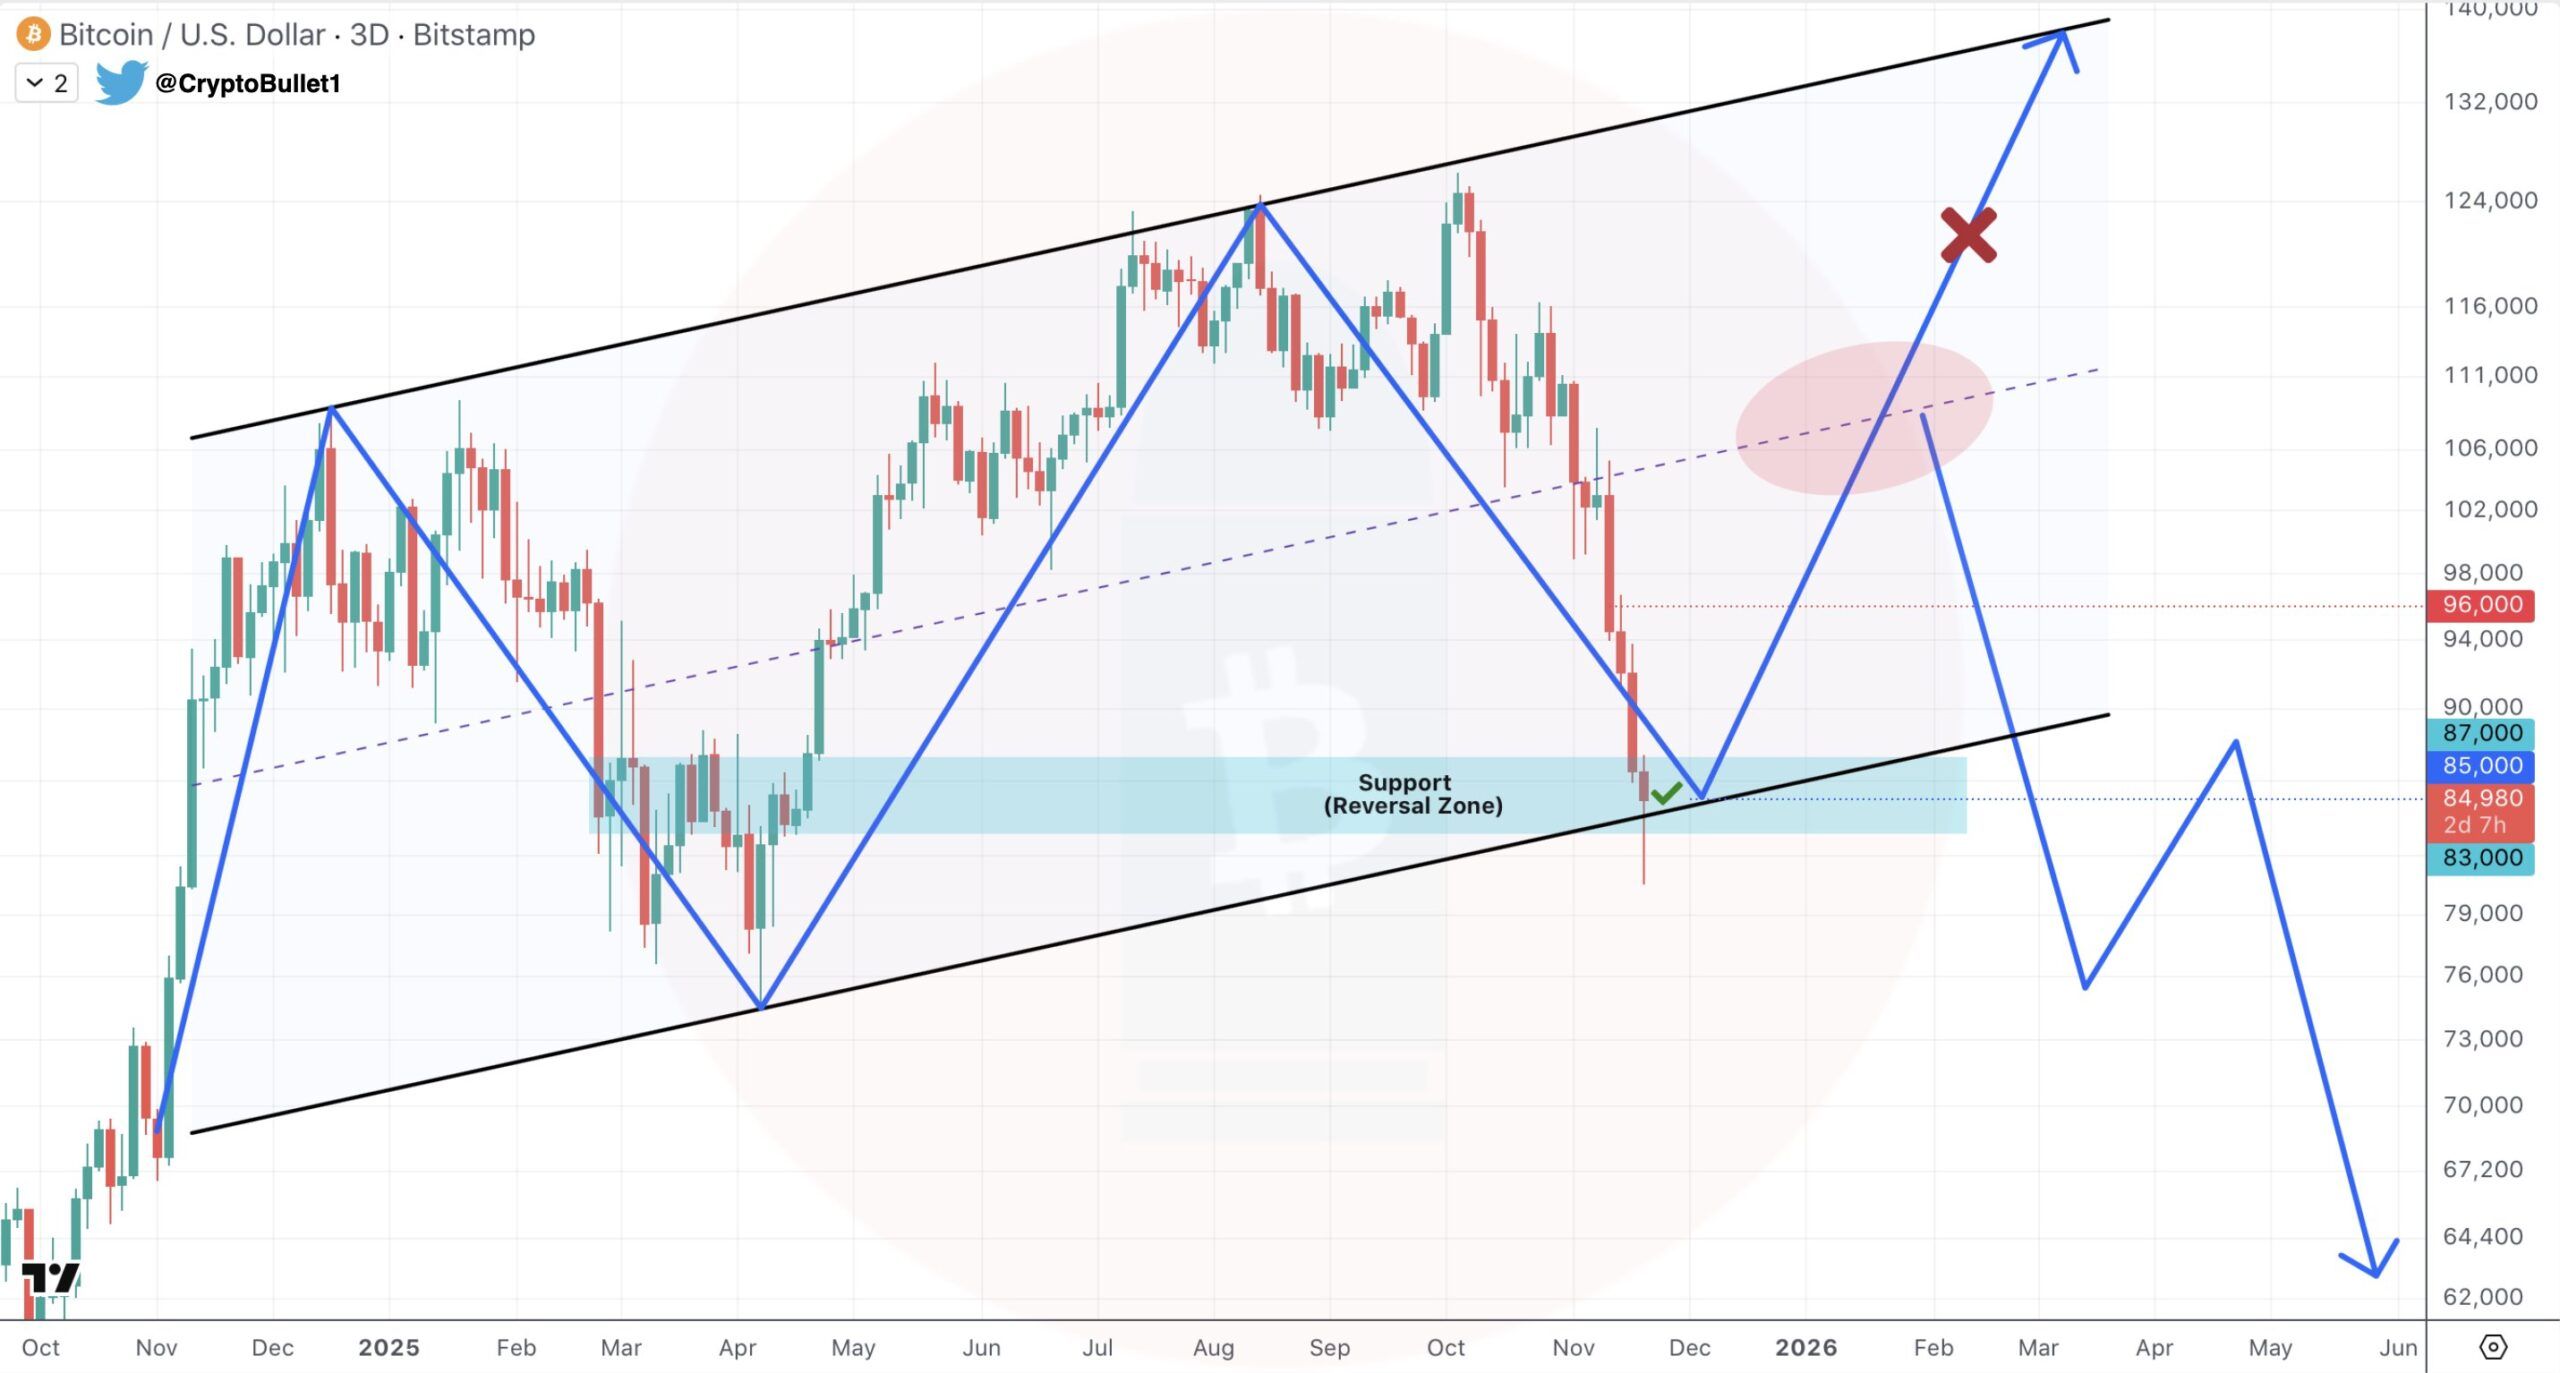
A new 3-day chart shared by prominent analyst CryptoBullet highlights a compelling technical setup. Bitcoin continues to trade within a broad ascending parallel channel, a structure that has guided price action throughout the past year.
The latest correction has pushed BTC directly into the lower boundary support of this channel—near the $80K region—where buyers are beginning to show early signs of resilience.
 Credits: @CryptoBullet1 (X)
CryptoBullet suggests that if bulls can defend this level, Bitcoin may attempt a recovery toward the $100K–$108K range, following the same pattern of sharp drop → channel support retest → strong rebound that previously played out twice within this structure.
However, a clean breakdown below the channel could invalidate this pattern entirely and open the door for deeper downside—something the chart cautiously hints at with a lower projection if support fails.