Hedera Tumbles 4% as Altcoins Continue to Suffer

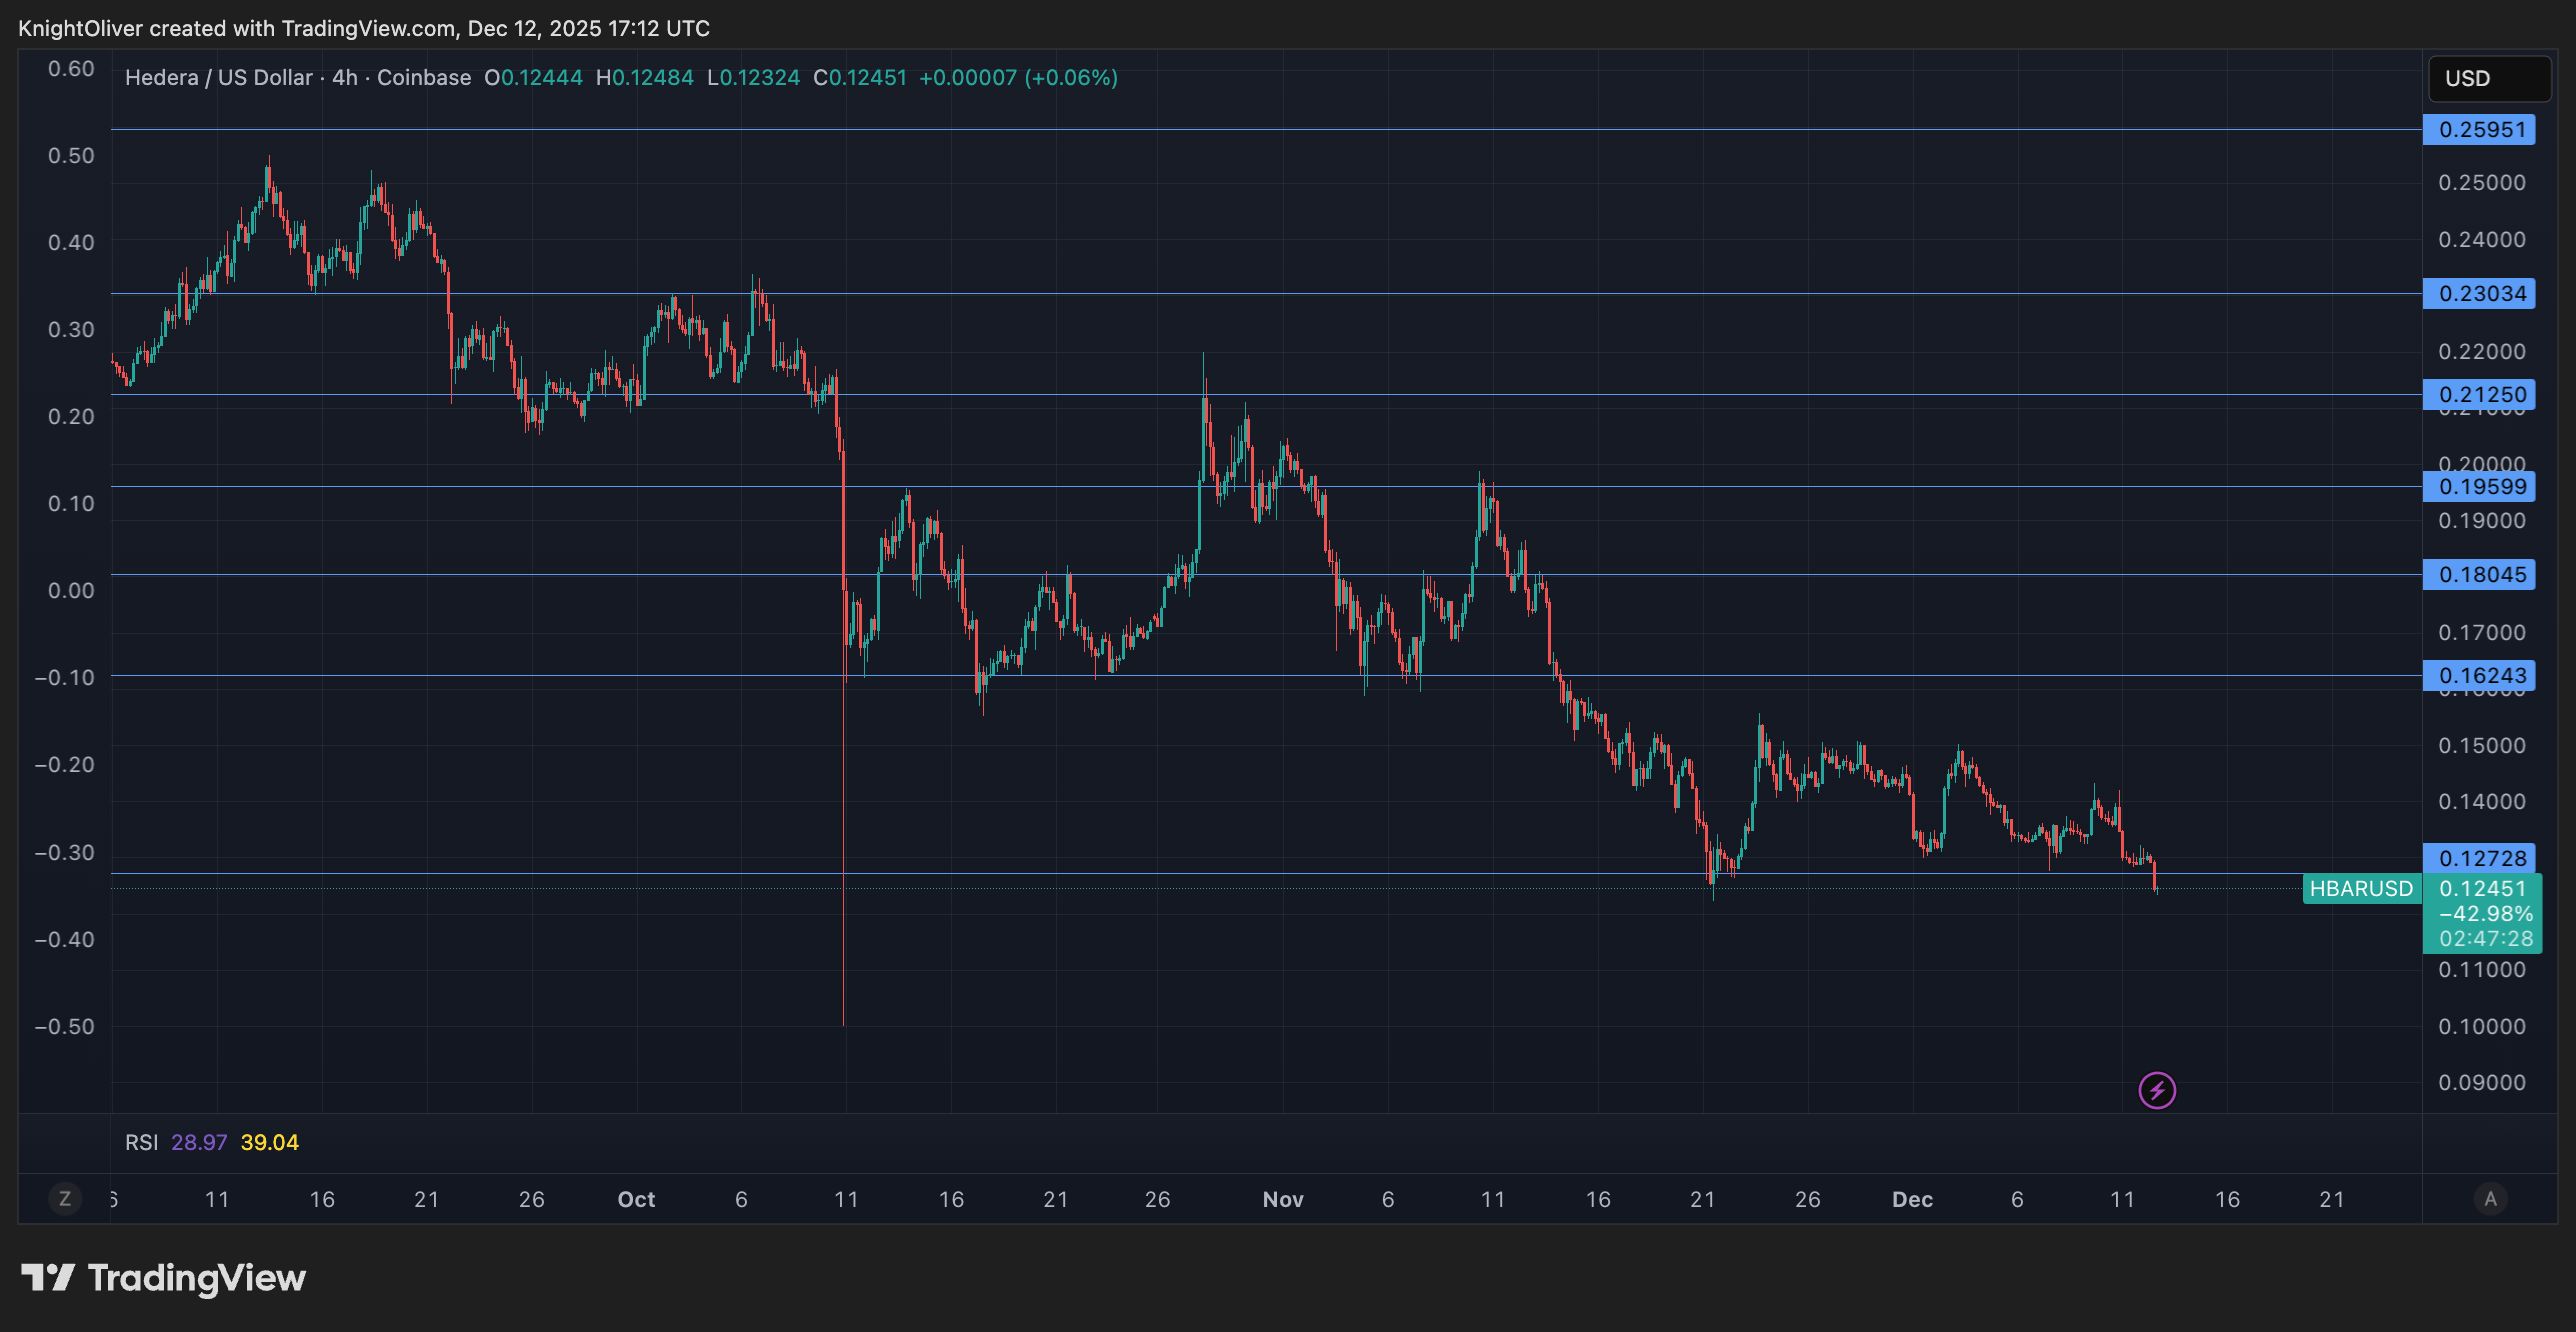
HBAR trades lower Thursday after breaking through multiple technical levels during an afternoon selloff that pushed the token down 4% to $0.1247.
The native token of the Hedera network posts a $0.0082 range representing 6.4% volatility as resistance at $0.1320 proves insurmountable for bulls attempting to extend gains.
Volume patterns reveal heightened institutional participation throughout the session. The surge in trading activity confirms genuine price discovery rather than low-liquidity movements characteristic of smaller altcoins.
The afternoon cascade establishes a clear lower high pattern from the initial Dec. 11 spike, creating deteriorating market structure that accelerates downward momentum through previously established support zones.
Technical levels at $0.1235 become paramount as HBAR tests critical support following rejection at $0.1320 resistance.
The stabilization pattern around $0.124-$0.125 following dramatic capitulation creates potential for mean reversion back to $0.126 resistance.
Traders remain cautious given the decisive break of higher timeframe support levels and exceptional volume during the decline that indicates conviction selling. This limits near-term upside potential despite the immediate price recovery that brings some relief to bulls.
Key technical levels signal consolidation range for HBAR
Support/Resistance:
- Immediate support established at $0.1235 following afternoon decline.
- Strong resistance confirmed at $0.1320 after multiple rejection attempts.
- New trading range between $0.123-$0.125 on 60-minute timeframes.
Volume Analysis:
- Exceptional surge to 165.9 million tokens (175% above 24-hour average) during key reversal.
- 60-minute flash crash volume peaked at 15.7 million (700% above hourly average).
- Sustained above-average activity confirming institutional participation.
Chart Patterns:
- Lower highs pattern established from Dec. 11 peak creating bearish structure.
- Flash crash and recovery formation suggesting accumulation near support.
- Deteriorating momentum through multiple support levels indicating trend shift.
Targets & Risk/Reward:
- Immediate upside target at $0.126 mean reversion level.
- Downside risk to $0.123 support floor if current consolidation fails.
- Key resistance remains $0.1285 where initial breakdown occurred.
Disclaimer: The content of this article solely reflects the author's opinion and does not represent the platform in any capacity. This article is not intended to serve as a reference for making investment decisions.
You may also like
ETH Whale Resumes Buying Spree After Market Dip
Major ETH whale withdraws $119M in ETH from Binance after borrowing $85M USDT, signaling renewed buying interest.Massive Borrowing and ETH Withdrawal from BinanceWhat It Means for Ethereum and the Market

How Platforms Endorsed by Regulators Are Transforming Clean Energy Markets: Ushering in Greater Transparency and Market Fluidity
- CFTC-approved CleanTrade platform addresses fragmented clean energy markets by enabling transparent trading of vPPAs, PPAs, and RECs with $16B in notional value within two months. - Integration with REsurety's CleanSight analytics and S&P Global benchmarks reduces financial risks and establishes pricing standards, attracting institutional investors seeking accountability. - The platform's success signals maturing clean energy markets, democratizing access and aligning financial flows with decarbonization

Clean Energy Derivatives: Pioneering the Next Era of Commodity Markets
- Clean energy derivatives market is projected to grow from $39T to $125T by 2032, driven by institutional adoption and CFTC-approved platforms like CleanTrade. - CleanTrade, a CFTC-sanctioned SEF, addresses market opacity by enabling transparent, liquid trading of VPPAs and other clean energy contracts. - High-profile transactions like Cargill-Mercuria trades validate the platform, while policy incentives and ESG alignment accelerate institutional investment in renewables. - Regulatory advancements and in

Strategic advancements in infrastructure and regulatory frameworks enhance liquidity in clean energy markets and improve PPA risk management
- Corporate demand for renewable energy drives PPA growth, with 83% of 2024 European PPAs led by tech giants like Google and Amazon . - EU regulations like CBAM and CSRD enforce 24/7 carbon-free energy standards, pushing 70% of companies to modernize PPA strategies with GOs. - Strategic infrastructure innovations, including long-duration storage and hybrid gas-clean energy models, address intermittency and grid stability. - Aggregated/virtual PPAs and EIB's €500M pilot program lower barriers for SMEs, expa