Date: Wed, Dec 17, 2025 | 06:50 AM GMT
The broader cryptocurrency market has been experiencing choppy price action over the past several weeks, a phase that began after the sharp sell-off on October 10. That correction dragged Bitcoin (BTC) from sub-$120,000 levels down toward the current $86,000 zone. Over the last 30 days alone, BTC has declined by nearly 17%, keeping overall market sentiment cautious and risk appetite subdued.
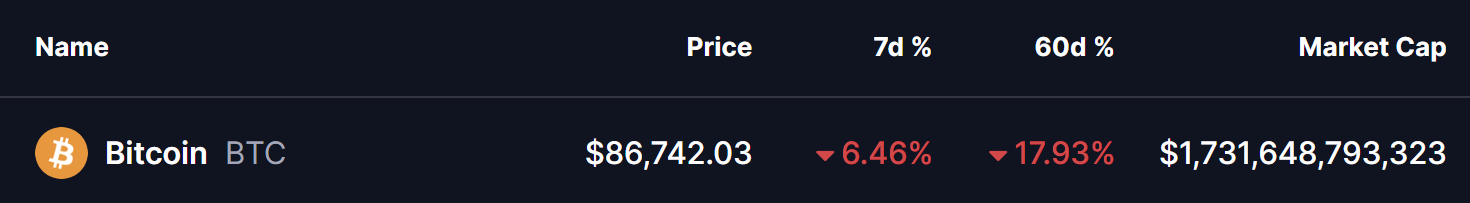 Source: Coinmarketcap
Despite the weakness, the higher-timeframe chart is beginning to reveal a familiar technical structure. Price behavior now suggests that downside momentum may be fading, raising the possibility that Bitcoin could be preparing for a trend reversal rather than a continuation of the recent decline.
Fractal Setup Hints at a Bullish Reversal
On the daily timeframe, Bitcoin’s price movement appears to be repeating a pattern seen earlier in the year. During both April and the current December phase, BTC experienced sharp corrections while carving out descending broadening wedge formations — a structure often associated with selling exhaustion and trend reversals.
In the previous instance, BTC bounced from the wedge’s lower boundary, entered a period of choppy consolidation, and eventually broke out above the descending resistance. That breakout was followed by a decisive reclaim of the 50-day and 100-day moving averages, which acted as confirmation of trend reversal and ultimately fueled a strong rally of nearly 48%.
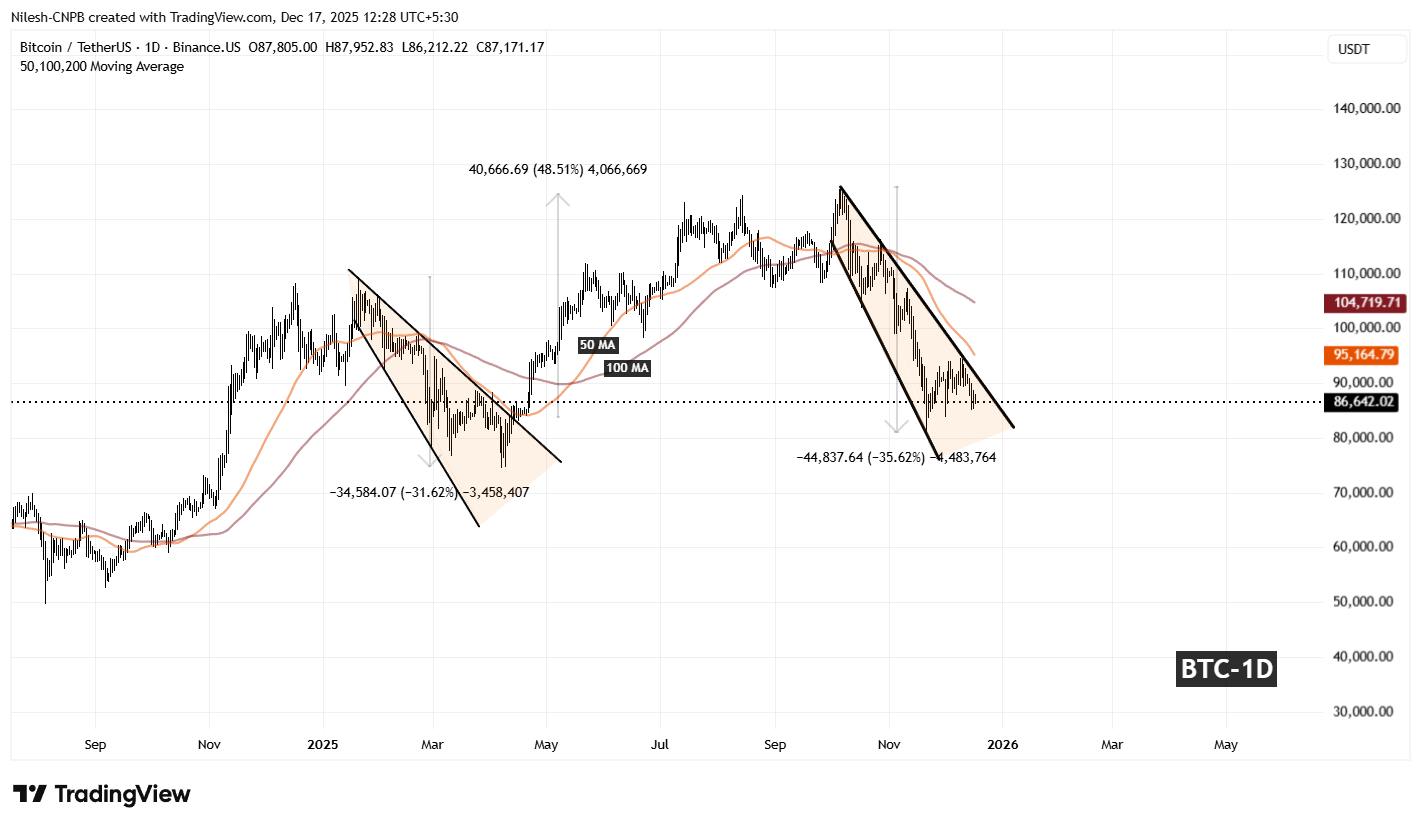 Bitcoin (BTC) Daily Chart/Coinsprobe (Source: Tradingview)
Now in December, Bitcoin seems to be following the same playbook. Price has once again formed a descending broadening wedge, rebounded from the $80,811 low, and is currently hovering near the $86,700 region. BTC remains capped below the wedge’s upper resistance trendline and trades under both the 50-day and 100-day moving averages — conditions that closely mirror the early stages of the prior reversal fractal.
This resemblance suggests that the market may once again be transitioning from a corrective phase into a potential recovery structure, provided key levels are reclaimed.
What’s Next for BTC?
If the fractal continues to unfold in a similar manner, a clean breakout above the descending resistance trendline near the $90,000 level would serve as a critical bullish confirmation. Such a move, combined with a reclaim of the 50-day and 100-day moving averages, could shift momentum decisively back in favor of the bulls.
Under this scenario, Bitcoin could target the $107,400 region, representing a potential upside of roughly 23% from current levels and aligning with prior rally projections seen earlier in the cycle.
On the downside, failure to hold structure would weaken the bullish narrative. A breakdown below the recent swing low at $80,811 would invalidate the fractal setup, opening the door to extended consolidation or renewed downside pressure in the near term.
For now, Bitcoin remains at a technical crossroads. Traders and investors are likely to remain patient, closely watching for a confirmed breakout before positioning for the next major directional move.