
XRP Price Turns Lower as a Familiar Pattern Reappears Again

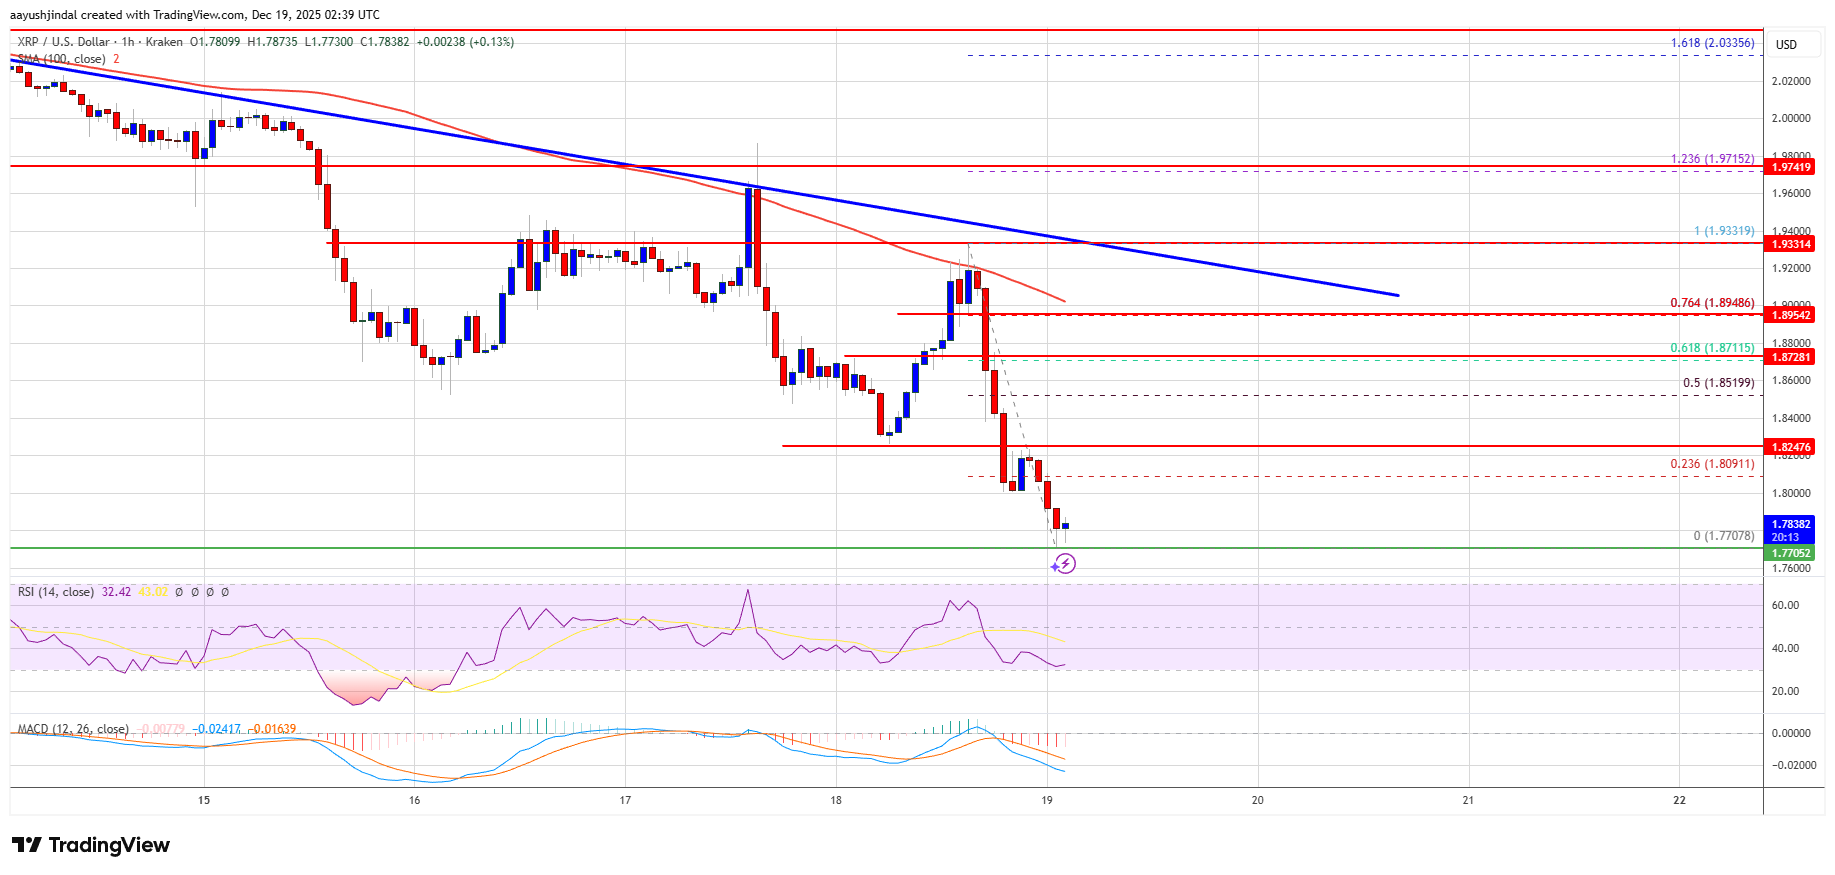
XRP price failed to gain pace above $1.920 and trimmed gains. The price is now struggling and faces resistance near the $1.820 level.
- XRP price started a fresh decline below the $1.850 zone.
- The price is now trading below $1.850 and the 100-hourly Simple Moving Average.
- There is a bearish trend line forming with resistance at $1.920 on the hourly chart of the XRP/USD pair (data source from Kraken).
- The pair could continue to move down if it settles below $1.780.
XRP Price Dips To New Weekly Lows
XRP price attempted a recovery wave above $1.90 but failed to continue higher, like Bitcoin and Ethereum. The price started a fresh decline below $1.880 and $1.850.
There was a move below the $1.820 support level. A low was formed at $1.7707, and the price is now showing bearish signs below the 23.6% Fib retracement level of the downward move from the $1.9331 swing high to the $1.7707 low.
The price is now trading below $1.850 and the 100-hourly Simple Moving Average. There is also a bearish trend line forming with resistance at $1.920 on the hourly chart of the XRP/USD pair.
If there is a fresh upward move, the price might face resistance near the $1.810 level. The first major resistance is near the $1.8520 level or the 50% Fib retracement level of the downward move from the $1.9331 swing high to the $1.7707 low. A close above $1.8520 could send the price to $1.880.
 Source:
XRPUSD on TradingView.com
Source:
XRPUSD on TradingView.com
The next hurdle sits at $1.920 and the trend line. A clear move above the $1.920 resistance might send the price toward the $1.9650 resistance. Any more gains might send the price toward the $2.00 resistance. The next major hurdle for the bulls might be near $2.050.
More Losses?
If XRP fails to clear the $1.8520 resistance zone, it could start a fresh decline. Initial support on the downside is near the $1.780 level. The next major support is near the $1.7620 level.
If there is a downside break and a close below the $1.7620 level, the price might continue to decline toward $1.720. The next major support sits near the $1.70 zone, below which the price could continue lower toward $1.680.
Technical Indicators
Hourly MACD – The MACD for XRP/USD is now gaining pace in the bearish zone.
Hourly RSI (Relative Strength Index) – The RSI for XRP/USD is now below the 50 level.
Major Support Levels – $1.780 and $1.7620.
Major Resistance Levels – $1.8520 and $1.920.
Disclaimer: The content of this article solely reflects the author's opinion and does not represent the platform in any capacity. This article is not intended to serve as a reference for making investment decisions.
You may also like
In-depth Report Finding Stability in Turbulent Times: Vince Trust Builds a New Direction for Wealth Growth for Investors in 2026

CPChain Joins ChainList on the EVM Network, Expanding Global Web3 Access and Wallet Integration
Altcoin season delayed? Technical weakness keeps altcoins below 200-day SMA while Bitcoin dominance rises
비트코인 현물 ETF 자금 이탈... 신규 비트코인 프리세일 모금액 2,900만 달러 돌파
