
Bitcoin Hovering In A Descending Range, But Alts Are Quietly Gaining Momentum

By:Newsbtc
Bitcoin is holding steady within a descending range, showing little directional conviction, while several altcoins are quietly building strength. As the market consolidates, these smaller assets could hint at early upside moves before BTC breaks out.
Key Resistance In Focus: $90,588 And The Descending Trendline
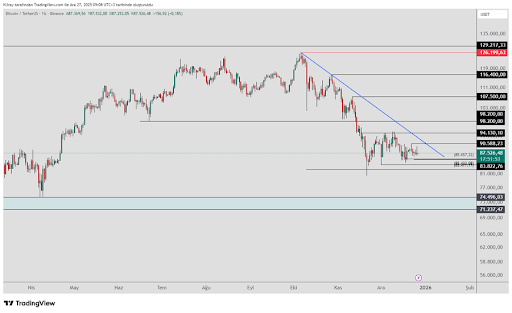
According to a recent update by Kamile Uray, there are no changes in the key levels being tracked on the daily chart, as the focus remains on the $90,588 level and the descending blue trendline. Unless BTC can close above these levels, the current decline may continue. Any upward moves below the blue descending trend are considered corrective rather than a trend reversal.
The first support zone to monitor during the decline is between $83,822 and $82,477. A daily close below $82,477 would signal a continuation of the downtrend and could open the door toward the $74,496–$71,237 zone, marked by the blue box. This lower zone is viewed as a strong support area where buyers may step in.
var rnd = window.rnd || Math.floor(Math.random()*10e6); var pid607465 = window.pid607465 || rnd; var plc607465 = window.plc607465 || 0; var abkw = window.abkw || ''; var absrc = 'https://servedbyadbutler.com/adserve/;ID=172179;size=0x0;setID=607465;type=js;sw='+screen.width+';sh='+screen.height+';spr='+window.devicePixelRatio+';kw='+abkw+';pid='+pid607465+';place='+(plc607465++)+';rnd='+rnd+';click=CLICK_MACRO_PLACEHOLDER'; document.write('
');
if (!window.AdButler){(function(){var s = document.createElement("script"); s.async = true; s.type = "text/javascript";s.src = "https://servedbyadbutler.com/app.js";var n = document.getElementsByTagName("script")[0]; n.parentNode.insertBefore(s, n);}());}
var AdButler = AdButler || {}; AdButler.ads = AdButler.ads || []; var abkw = window.abkw || ""; var plc366606 = window.plc366606 || 0; (function(){ var divs = document.querySelectorAll(".plc366606:not([id])"); var div = divs[divs.length-1]; div.id = "placement_366606_"+plc366606; AdButler.ads.push({handler: function(opt){ AdButler.register(172179, 366606, [728,90], "placement_366606_"+opt.place, opt); }, opt: { place: plc366606++, keywords: abkw, domain: "servedbyadbutler.com", click:"CLICK_MACRO_PLACEHOLDER" }}); })();
 BTC still below a descending trendline | Source:
Chart from Kamile Uray on X
BTC still below a descending trendline | Source:
Chart from Kamile Uray on X
Thus, a clear reversal confirmation is key before considering any significant upward move. Once confirmed, a rally toward the blue descending trendline could follow, testing resistance levels along the way.
For the uptrend to resume decisively, BTC would need to close above $90,588 and break the descending resistance. Meanwhile, a daily close above $94,130 would confirm that the blue descending trend has been broken, potentially signaling a shift to sustained bullish momentum.
LTF Moves Show Less Impulse, But Structure Holds
Crypto analyst The Penguin noted that the lower time frame (LTF) is showing slightly less impulsive action, though the overall count remains unchanged. The recent moves on the LTF appear more like noise and do not affect the broader wave count, and confidence in a leading diagonal for wave 1 remains intact.
var rnd = window.rnd || Math.floor(Math.random()*10e6); var pid607472 = window.pid607472 || rnd; var plc607472 = window.plc607472 || 0; var abkw = window.abkw || ''; var absrc = 'https://servedbyadbutler.com/adserve/;ID=172179;size=0x0;setID=607472;type=js;sw='+screen.width+';sh='+screen.height+';spr='+window.devicePixelRatio+';kw='+abkw+';pid='+pid607472+';place='+(plc607472++)+';rnd='+rnd+';click=CLICK_MACRO_PLACEHOLDER'; document.write('
');
if (!window.AdButler){(function(){var s = document.createElement("script"); s.async = true; s.type = "text/javascript";s.src = "https://servedbyadbutler.com/app.js";var n = document.getElementsByTagName("script")[0]; n.parentNode.insertBefore(s, n);}());}
var AdButler = AdButler || {}; AdButler.ads = AdButler.ads || []; var abkw = window.abkw || ""; var plc452518 = window.plc452518 || 0; (function(){ var divs = document.querySelectorAll(".plc452518:not([id])"); var div = divs[divs.length-1]; div.id = "placement_452518_"+plc452518; AdButler.ads.push({handler: function(opt){ AdButler.register(172179, 452518, [728,90], "placement_452518_"+opt.place, opt); }, opt: { place: plc452518++, keywords: abkw, domain: "servedbyadbutler.com", click:"CLICK_MACRO_PLACEHOLDER" }}); })();
Putting Elliott Wave analysis aside for a moment and leaning on standard technical analysis, BTC is clearly respecting a defined range. As a result, a minor deviation toward the 0.886 level marked on the chart is being closely watched as a potential entry point.
Bullish confirmation will come if BTC manages to close and hold above $90,500, which would invalidate the current bearish scenario and signal the potential for a more sustained upward trend. Until then, the short-term fluctuations are considered normal noise, especially with the yearly open approaching.
On the altcoin side, momentum appears to be holding, suggesting potential upside. Outperformance is already visible in altcoins like XPL, indicating that while BTC consolidates, some alts are starting to push higher.
var rnd = window.rnd || Math.floor(Math.random()*10e6); var pid607473 = window.pid607473 || rnd; var plc607473 = window.plc607473 || 0; var abkw = window.abkw || ''; var absrc = 'https://servedbyadbutler.com/adserve/;ID=172179;size=0x0;setID=607473;type=js;sw='+screen.width+';sh='+screen.height+';spr='+window.devicePixelRatio+';kw='+abkw+';pid='+pid607473+';place='+(plc607473++)+';rnd='+rnd+';click=CLICK_MACRO_PLACEHOLDER'; document.write('
');
if (!window.AdButler){(function(){var s = document.createElement("script"); s.async = true; s.type = "text/javascript";s.src = 'https://servedbyadbutler.com/app.js';var n = document.getElementsByTagName("script")[0]; n.parentNode.insertBefore(s, n);}());}
var AdButler = AdButler || {}; AdButler.ads = AdButler.ads || []; var abkw = window.abkw || ''; var plc452519 = window.plc452519 || 0; (function(){ var divs = document.querySelectorAll(".plc452519:not([id])"); var div = divs[divs.length-1]; div.id = "placement_452519_"+plc452519; AdButler.ads.push({handler: function(opt){ AdButler.register(172179, 452519, [728,90], 'placement_452519_'+opt.place, opt); }, opt: { place: plc452519++, keywords: abkw, domain: 'servedbyadbutler.com', click:'CLICK_MACRO_PLACEHOLDER' }}); })();
 BTC trading at $87,481 on the 1D chart | Source: BTCUSDT on
Tradingview.com
BTC trading at $87,481 on the 1D chart | Source: BTCUSDT on
Tradingview.com
0
0
Disclaimer: The content of this article solely reflects the author's opinion and does not represent the platform in any capacity. This article is not intended to serve as a reference for making investment decisions.
PoolX: Earn new token airdrops
Lock your assets and earn 10%+ APR
Lock now!
You may also like
Memecoin Dominance Hits All-Time Lows: 5 High-Risk Coins That Could Lead the Next Speculative Rebound
Cryptonewsland•2025/12/28 02:33
Best Apple Watch apps for boosting your productivity
TechCrunch•2025/12/28 02:21

What Does XRP Really Do? Expert Explains What It Is Built For
Newsbtc•2025/12/28 02:18

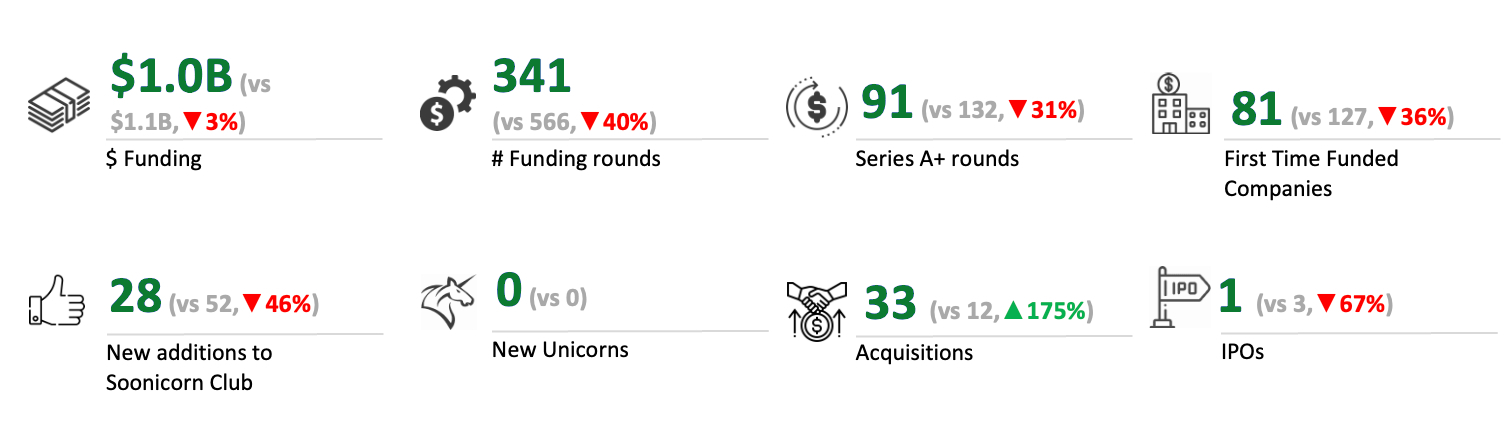
India startup funding hits $11B in 2025 as investors grow more selective
TechCrunch•2025/12/28 01:06
Trending news
MoreCrypto prices
MoreBitcoin
BTC
$87,743.76
+0.39%
Ethereum
ETH
$2,944.97
+0.61%
Tether USDt
USDT
$0.9993
-0.01%
BNB
BNB
$840.87
+0.73%
XRP
XRP
$1.87
+1.25%
USDC
USDC
$0.9998
-0.01%
Solana
SOL
$124.1
+1.47%
TRON
TRX
$0.2838
+1.40%
Dogecoin
DOGE
$0.1240
+1.10%
Cardano
ADA
$0.3692
+4.66%
How to buy BTC
Bitget lists BTC – Buy or sell BTC quickly on Bitget!
Trade now
Become a trader now?A welcome pack worth 6200 USDT for new users!
Sign up now