Date: Mon, April 21, 2025 | 08:54 AM GMT
In the cryptocurrency market over the past week, major altcoins are starting to show signs of recovery after enduring sharp corrections since the start of the year. Among them, the AI-focused token Artificial Superintelligence Alliance (FET) has come into the spotlight with an impressive weekly gain of 22%, fueled by a major technical breakout on the lower timeframes.
Meanwhile, Worldcoin (WLD) — a project aiming to build a global identity and finance network — is flashing a very similar setup to FET’s recent breakout, suggesting that a short-term rally could be just around the corner.
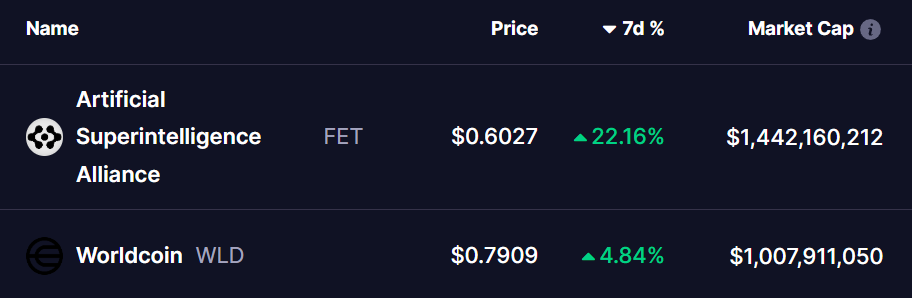 Source: Coinmarketcap
FET and WLD Fractal Analysis
On the FET 4-hour chart, momentum shifted when it reclaimed the green resistance zone around $0.53–$0.54, flipping it into strong support. After that, FET didn’t slow down — it cleanly broke through the blue resistance near $0.57–$0.58, confirming a bullish breakout.
That move triggered a 15% rally, sending FET toward the next major supply zone between $0.65–$0.66 (highlighted in orange).
Meanwhile, looking at WLD’s 3-hour chart, the structure looks very similar — but it’s still in the making.
WLD has reclaimed the green zone near $0.77–$0.79 and is now on the verge of a breakout. A successful move above the blue resistance at $0.84–$0.85 could open the doors for a strong rally, potentially pushing WLD toward the next major target around $1.00, where the orange supply zone awaits.
What’s Next?
For WLD, all eyes are now on the $0.77–$0.79 zone. A decisive breakout above this resistance could fuel a move similar to FET’s recent surge. However, failure to break through could trigger another short-term pullback. Traders will likely watch for strong volume and a solid close above the blue zone to confirm the next bullish leg higher.
Disclaimer: This article is for informational purposes only and not financial advice. Always conduct your own research before investing in cryptocurrencies.

![[Bitpush Daily News Highlights] US Treasury Secretary Bessent: Stablecoin market size may grow to $3 trillion by 2030; Canary XRP ETF has completed listing certification on Nasdaq and will begin trading at market open; Federal Reserve mouthpiece: Most regional Fed voting members are not enthusiastic about a rate cut in December; SEC plans to introduce a “token taxonomy”: anchored to the Howey Test, exploring crypto assets](https://img.bgstatic.com/multiLang/image/social/2784dd8e7bd27fe052703623026817c01762923962365.png)