Toncoin price soars as cryptocurrencies crash, here’s why
Toncoin continues to surge, climbing to $3.60 and notching a 38% gain from its June low, as renewed investor interest and ecosystem momentum breathed new life into the Telegram-linked blockchain.
- Toncoin price jumped after STON.fi, its biggest dApp raised $6.5 million from Ribbit Capital.
- It also jumped as it became the fastest-growing chain in the last seven days.
- TON has also formed the highly bullish double-bottom pattern.
Toncoin (TON) token jumped for five consecutive days, reaching a high of $3.60, up by 38% from its lowest level in June. At last check Saturday, it hovered at around $3.54. This surge pushed its market capitalization to over $3.7 billion.
TON price jumped after the biggest decentralized application in its ecosystem, STON.fi, raised $9.5 million in funding on July 30, a sign that investors are optimistic about its platform. It raised these funds from Ribbit Capital and CoinFund to fund its growth.
🚀 https://t.co/FWINlY7Lnn Dev has raised a $9.5M Series A led by Ribbit Capital & CoinFund — solidifying our role as the core DeFi layer on TON.
— STON.fi (@ston_fi) July 30, 2025
With $6B+ volume, 27M+ txs & 80%+ TON user share, this is just the beginning.
Next: limit orders, Omniston cross-chain, DAO.
Read… pic.twitter.com/a204rfHTjz
DeFi Llama data shows that STON handled over $6.7 million in volume in the last 24 hours and $113.33 million during the previous 30 days.
TON price also jumped as its transactions soared. Nansen data shows that Ton Blockchain was the third-fastest growing blockchain in the last seven days, as its active transactions jumped by 32% to 3.8 million.
Its fees rose by 52% in the same period, while the active addresses jumped by 5%. These numbers mean that the network is doing well among users.
The token also jumped after the TON Foundation and Kingsway Capital Partners joined to raise $400 million to create a treasury company to accumulate Toncoin.
The new, unnamed company will aim to replicate what other firms have done in the past few years, as they seek to build on the success of Strategy and Metaplanet.
Toncoin price technical analysis

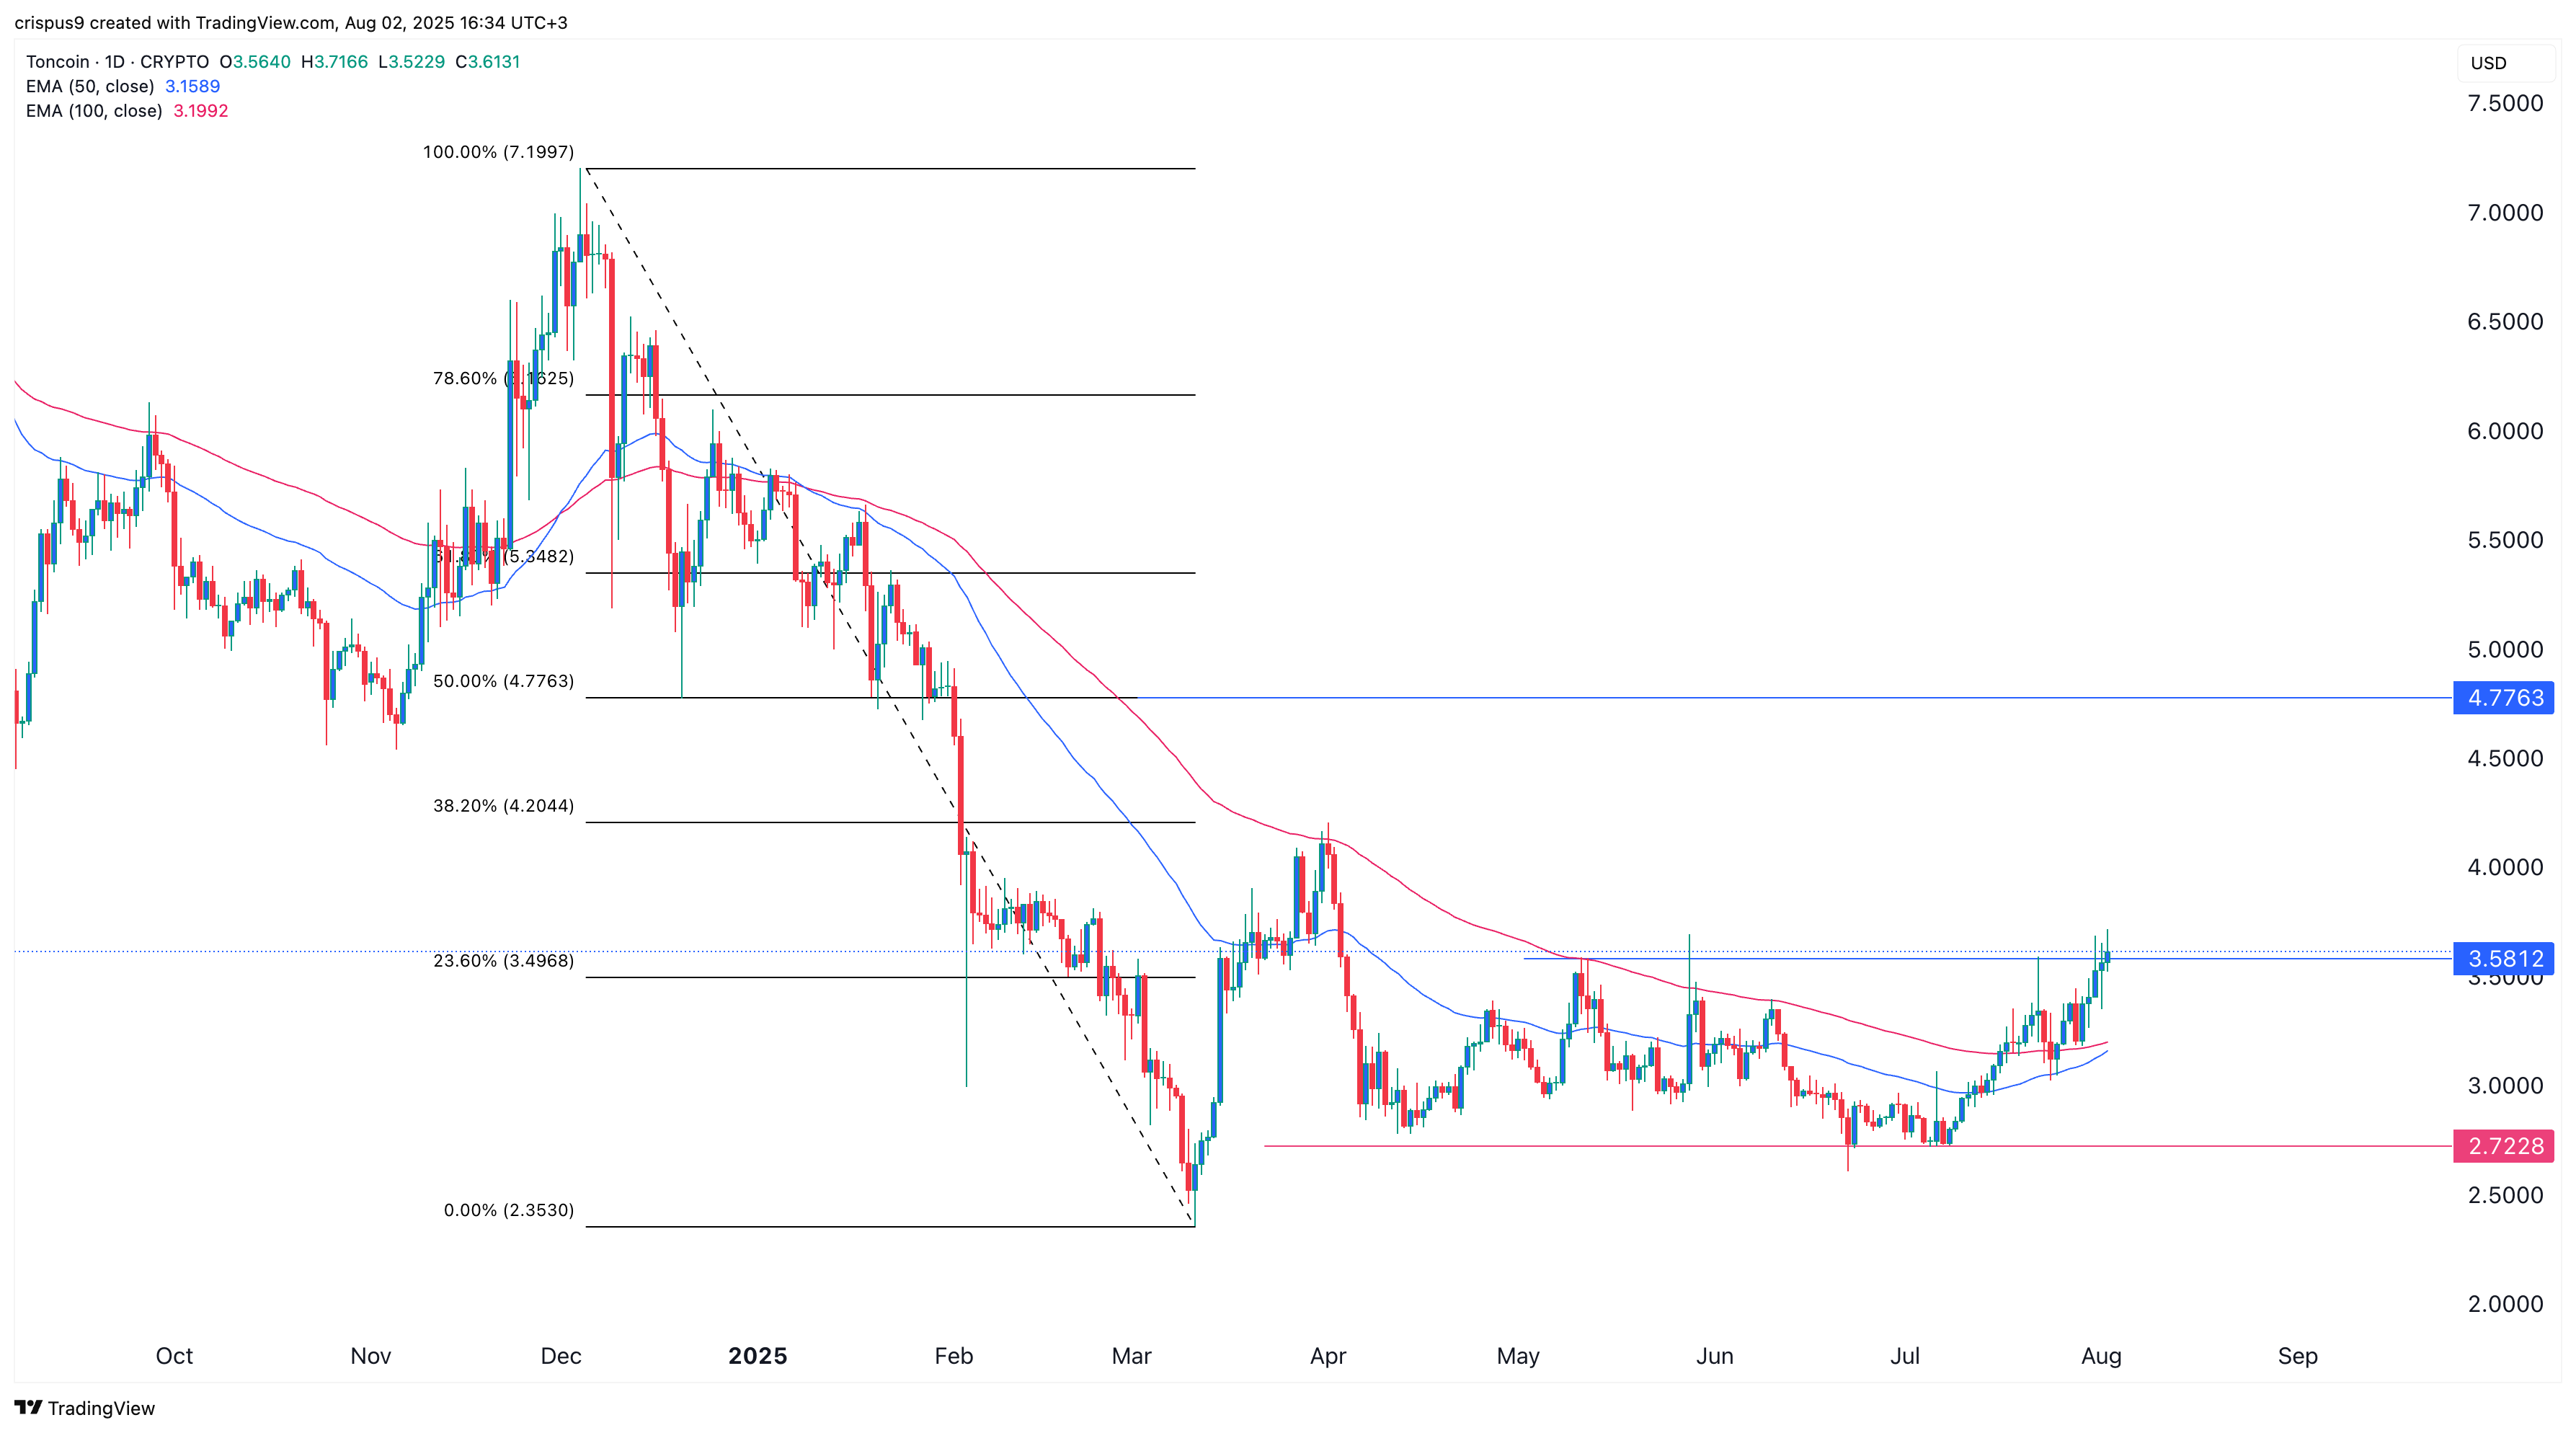
The daily chart shows that the TON price also jumped after forming a double-bottom pattern at $2.722. This is a typical pattern characterized by two lower levels and a neckline, which, in this case, was at $3.5812. It is one of the most common bullish reversal patterns.
The price of Toncoin jumped above the 23.6% Fibonacci Retracement level, while the 50-day and 100-day moving averages are about to cross each other. Therefore, the token will likely continue rising as bulls target the key resistance level at $4.77, the 50% retracement level.
Disclaimer: The content of this article solely reflects the author's opinion and does not represent the platform in any capacity. This article is not intended to serve as a reference for making investment decisions.
You may also like
Crypto Trends Capture Attention as Market Struggles

Can Ethena hold $0.20 after 101M ENA flood exchanges?

Galaxy Digital, Which Manages Billions of Dollars, Reveals Its Bitcoin, Ethereum, and Solana Predictions for 2026
A Brief History of Blockchain Wallets and the 2025 Market Landscape

