

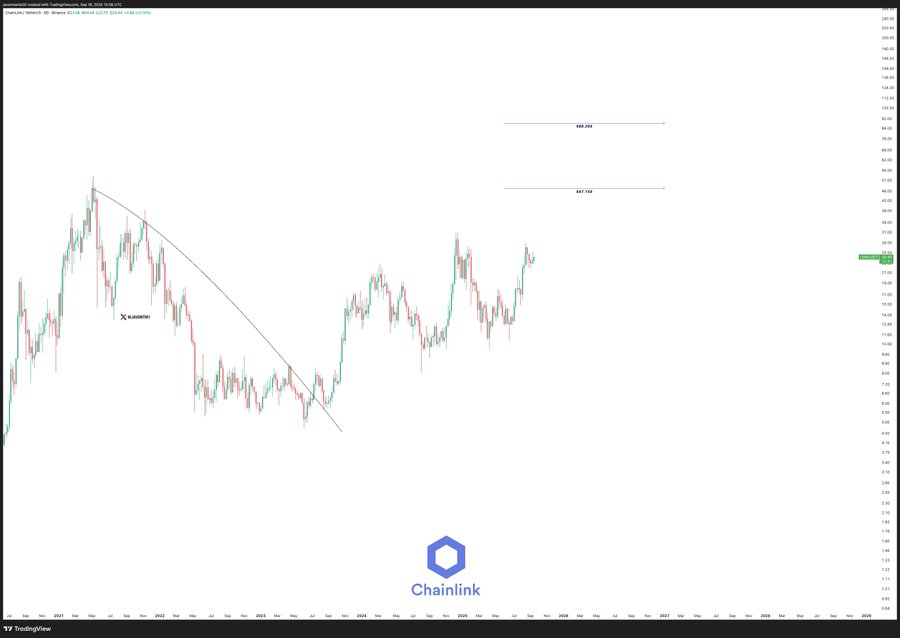
- LINK broke a multi-year downtrend in mid-2023, forming higher highs and higher lows into 2025.
- The first major resistance level is set at $47.154, reflecting a possible 90% upside from current price levels.
- A second technical target at $88.264 represents a potential 255% gain, marking the next key checkpoint in the trend.
Chainlink’s token (LINK) has maintained a steady upward trajectory following a confirmed breakout from a long-term downtrend. The breakout occurred in mid-2023 when price action moved above a descending trendline that had held since late 2021. Recent market data shows the asset trading near $20.00, building on bullish price structure established after a key reversal point.
Breakout Confirmed After Multi-Month Decline
Between late 2021 and early 2023, analysis prepared by Javon Marks reveals that LINK moved in a controlled downtrend. The chart indicates a consistent series of lower highs and lower lows. This bearish sequence eventually led into a consolidation range where volatility tightened, and accumulation activity began.
 Source: X
After forming a base, price eventually broke above the trendline resistance. This breakout marked a structural shift in momentum. Since then, the chart has shown a steady pattern of higher lows and higher highs into mid-2025. The continuation of this structure has pushed the price above several previous resistance points.
Uptrend Structure and Short-Term Target
Current price behavior maintains a bullish formation . The chart reflects multiple impulsive movements to the upside after each period of consolidation. With price now holding above $20.00, two measured technical targets are drawn above the current range.
The first target sits at $47.154. From present price levels, this marks an approximate upside of 90%. This target is positioned above earlier price congestion zones, acting as a reference level within the larger uptrend. The chart identifies it as a near-term magnet level, based on the latest rally structure.
Higher Price Zone Also in Focus
In addition to the initial target, a second level has been identified further above. The $88.264 level lies over 255% higher than current price. Both target zones are marked clearly on the chart using horizontal range lines. These levels remain part of the wider technical setup developing after the breakout.
For now, the price continues to approach the lower of the two target levels. Market activity shows strong candles forming into resistance, with no return to the previous trendline. The bullish structure has held firm since breaking out from the accumulation zone in 2023.
Since exiting the accumulation range in early 2023, the market has preserved its positive price formation. Each push upward has followed a corrective pause, aligning with a typical continuation pattern. The trendline that capped price action for over a year has not been retested. With momentum holding and the structure undisturbed, the market continues to track toward predefined resistance levels now in focus.