
Can $55M Leverage Support Keep Ripple (XRP) Above the $2.50 Mark?

Analyzing the Role of Bullish Traders in Defending Key Support Levels Amid Market-wide Liquidations
Key Points
- Ripple’s price fell by 3%, trading as low as $2.78 on October 9, reflecting the broader market downturn.
- Despite the market downturn, data from derivatives exchanges show that Ripple bulls are aggressively covering positions to prevent further losses.
On October 9, the price of Ripple fell by 3%, trading as low as $2.78. This mirrored the downturn in the broader market, which was triggered by Bitcoin’s pullback from all-time highs, leading to cascading liquidations. However, the correction brought Ripple’s price below the $3 psychological support. Despite this, trading data from derivatives exchanges show that bulls are aggressively covering positions to prevent deeper losses.
Market Activity
According to Coinglass’s Liquidation map, which tracks active leverage positions deployed at key price levels, short traders dominated Ripple activity. On Thursday, $146 million in open short contracts were compared to $95 million in longs. However, around $55 million in leveraged long contracts are clustered near $2.7, accounting for 58% of all active bullish leverage. This large leverage cluster signals an intent to defend key price levels below it.
Aggregate market flows also highlight Ripple’s relative resilience. Market-wide liquidations topped $679 million, with Bitcoin and Ethereum bulls taking the biggest losses with $188 million and $181 million in liquidated long contracts respectively. Despite being the fifth-largest cryptocurrency by market cap, Ripple bulls lost only $17 million in the last 24 hours. This reflects Ripple traders’ decision to cover their positions on Thursday, rather than keeping up with the pace of the broader market sell-off.
Price Forecast for Ripple
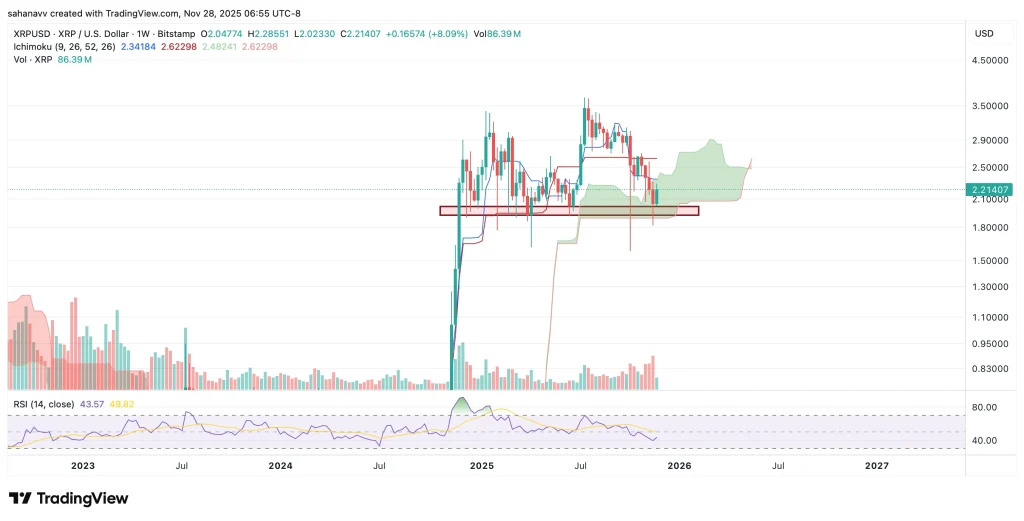
From a technical standpoint, Ripple’s current price setup reflects a developing double-bottom formation between $2.6 and $2.8, often interpreted as a bullish reversal pattern. A decisive breakout above this level would validate the double-bottom signal and could potentially trigger an upside continuation toward the projected bullish Ripple price target at $3.6.
Momentum indicators provide a cautiously bullish backdrop. The Relative Strength Index (RSI) currently hovers at 41, suggesting near-oversold conditions. This positioning typically favors a short-term bounce, particularly when coupled with compression on Bollinger Bands signaling potential volatility expansion. If bullish leverage around $2.7 continues to hold, Ripple may rebound toward $3.1 in the near term, followed by a breakout attempt toward $3.6. Conversely, failure to sustain the $2.7 support could invalidate the pattern, raising the risk of a breakdown toward the lower Bollinger Band at $2.50.
Disclaimer: The content of this article solely reflects the author's opinion and does not represent the platform in any capacity. This article is not intended to serve as a reference for making investment decisions.
You may also like
No wonder Buffett finally bet on Google
Google holds the entire chain in its own hands. It does not rely on Nvidia and possesses efficient, low-cost computational sovereignty.
HYPE Price Prediction December 2025: Can Hyperliquid Absorb Its Largest Supply Shock?
XRP Price Stuck Below Key Resistance, While Hidden Bullish Structure Hints at a Move To $3
Bitcoin Price Prediction: Recovery Targets $92K–$101K as Market Stabilizes